|
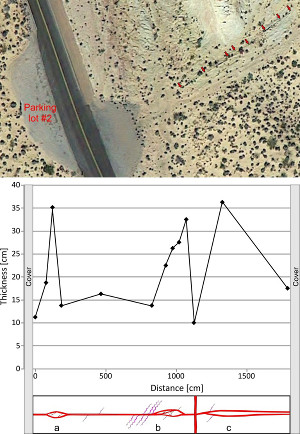
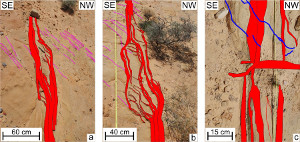
The process of the sequential addition of compaction bands to form a zone has been described under 'Mechanisms and Mechanics of Compaction Band Zones.' Although an extensive survey of their dimension is lacking, here is an example from Valley of Fire State Park reported by Torabi et al. (2015). Figure 1 is a plot of thickness measurement data, and Figure 2 shows detail maps along a compaction band zone exposed on the eastern side of the road and the adjacent parking lot (Parking Lot 2). The spikes in the thickness distribution reach about 40 cm locally, but the background thickness is about 20 cm. The maps show that the anomalously high thickness values are due to complexities such as relays, eye structures, and intersections.
 | | Figure 1. (a) A compaction band zone on a pavement on the eastern side of Parking Lot 2 along the road from the Visitor Center to White Domes (top photograph). (b) The plot of thickness measurements along the zone. The largest thickness is slightly above 40 cm. (c) The spikes in the thickness values correspond to complexities in the zone geometry. From Torabi et al. (2015). |
 | | Figure 2. Detailed maps showing the structural architecture of the complexities corresponding to the three spikes in the thickness distribution plot in Figure 1. From Torabi et al. (2015). |
| |
Torabi, A., Aydin, A., Cilona, A., Jarsto, B.E., Deng, S., 2015. The dynamics and interaction of compaction bands in Valley of Fire State Park, Nevada (USA): Implications for their growth, evolution, and geostatistical property. Tectonophysics 657: 113-128. http://dx.doi.org/10.1016/j.tecto.2015.06.029.
|

