| |||||||||||||||
|
|
|||||||||||||||
|
|
|||||||||||||||
| Mechanisms of Deformation | |||||||||||||||
|
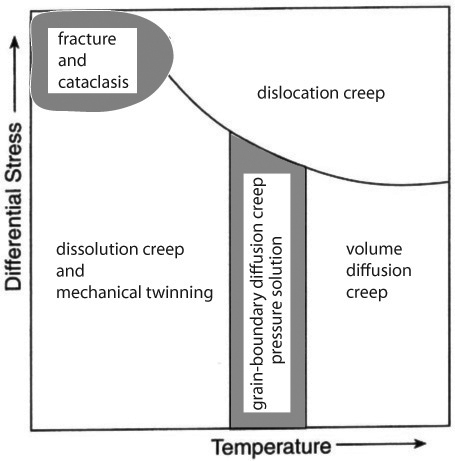
The branch of Deformation Mechanisms is a rich field, particularly in material science and metallurgy. In these disciplines, most common minerals, metals, alloys, and ceramics have been investigated extensively in the laboratory under various loading configurations, and corresponding deformation mechanism maps have been constructed (see, for example, Frost and Ashby at http://engineering.dartmouth.edu/defmech). Deformation mechanism maps show the field of stress, temperature, and strain-rate, among other parameters, over which each mechanism is dominant for a given material. To a lesser degree, deformation maps for some common Earth materials are also available. Most of these efforts in Earth Sciences were directed towards mechanisms of crystal plasticity, such as dislocations, twinning, diffusion, and creep. For a simplified example of this kind of map, see Figure 1 from Davis and Reynolds (1996), in which domains relevant to the structure classes in this Knowledgebase are highlighted.
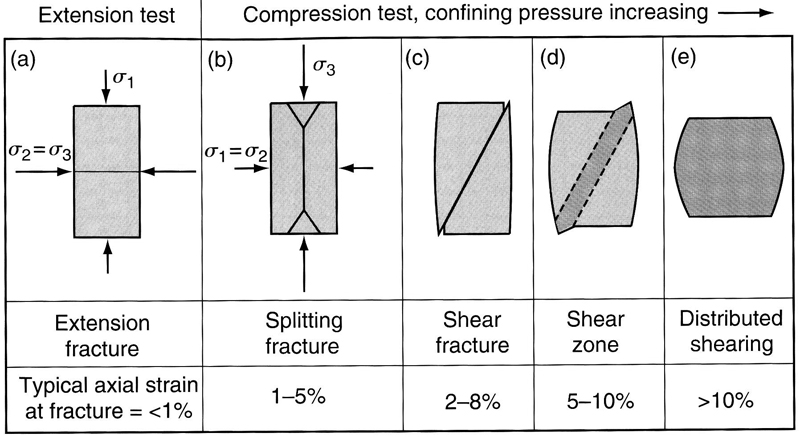
It is interesting to note that brittle fracturing, which is the major focus of this Knowledgebase, has been mapped in a small domain in the upper-left corner of the map in Figure 1. However, this is a rather simple picture. As noted by Paterson and Wong (2005), there is no simple universal law governing the level of stress at which a given rock type fractures. According to these authors, this is because this stress level involves all principal components of the stress, and the deformation mechanism depends on the mode of fracture. Perhaps more important, particularly for rocks and regions, is the difficulty of characterizing the geometry and distribution of inhomogeneities in rocks. Nevertheless, attempts have been made to construct deformation mechanisms of fractures as a function of confining pressure, pore pressure, strain, strain rate, and grain size, among other parameters, based on the laboratory experiments. Figure 2 shows one of the well-known earlier diagrams summarizing the results from extensive laboratory efforts by Griggs and Handin and their colleagues at UCLA during the 1950s. The figure used here is a simplified version of that by Griggs and Handin (1960, their Figure 1) by Pollard and Fletcher (2005). The qualitative inferences from this diagram are as follows: increasing confining pressure overcomes what was called extension fracturing (opening-mode fracturing) by the original authors observed in (a) and (b), enhances shear fracturing, the features inclined to the axial principal stresses in (c) and (d), and shearing localization in (d). Finally, the deformation regime in (e) represents uniform flow. Note that the total strain is well beyond the elastic limit in (c), (d), and (e), and that the ability to undergo large strains (see the lower row) is characteristic of shearing deformation.
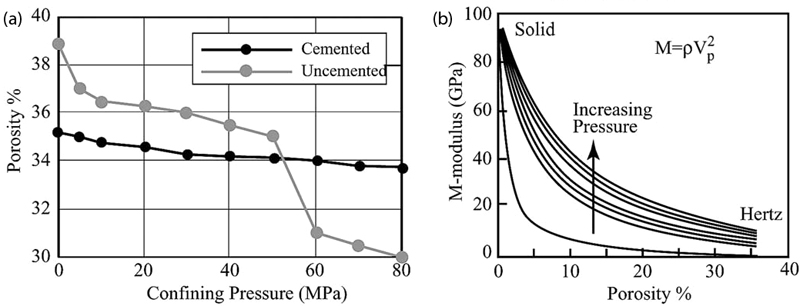
As opposed to most engineering materials, Earth materials have high porosity when they first form, and they undergo consolidation, compaction, and cementation to varying degrees during their maturation. Sediments with high void ratios are prone to pore collapse. The experimental results in Figure 3a show the reduction in porosity of cemented and uncemented granular material under increasing confining pressure. It turns out that cements at grain contacts, though they may represent a small volume fraction and be very weak, have a significant effect on the elastic moduli and failure behavior of granular materials. Figure 3b shows plots of M-modulus (density times the square of p-wave velocity) versus porosity for water-saturated, randomly packed glass beads subjected to varying confining pressure. The plot defines two end members: Hertzian contact behavior on the one end and an ideal solid-like behavior with no or very little porosity on the other end. Increasing confining pressure results in increasing M-modulus and higher strength.
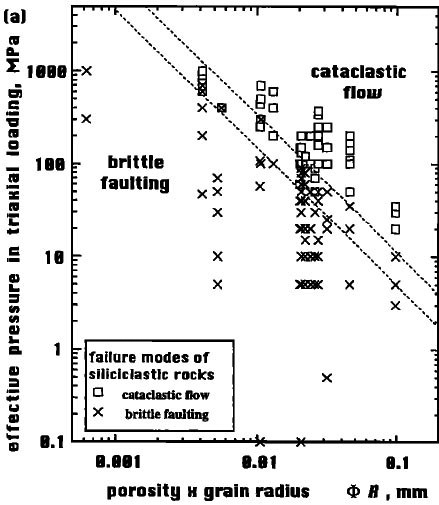
Figure 4 shows effective confining pressures being plotted against a product of porosity and grain size for 14 siliciclastic rocks deformed in the laboratory by various investigators (Wong et al., 1997). Since both grain size and porosity are known to affect rock failure, they should be considered in deformation mechanism maps. In this diagram, the parallel dotted lines with a slope of -3/2 bracket the transition from brittle faulting to cataclastic flow. Hence, the transition effective pressures are related to the product of porosity and grain size by a power of -3/2.
Other fracture or failure mechanisms relevant to the major structure classes (joints, pressure solution seams or bands, deformation bands, and faults) will be described under the individual structure classes. | |||||||||||||||
| Reference: |
|||||||||||||||
| Davis, G.H., Reynolds, S.J., 1996 Dvorkin, J., Nur, A., 1996 Griggs, D.T., Handin, J., 1960 Lawn, B.R., Wilshaw, T.R., 1975 Paterson, M.S., Wong, T.F., 2005 Pollard, D.D., Fletcher, R.C., 2005 Wong, T.F., David, C., Zhu, W., 1997 |
|||||||||||||||
|
Readme | About Us | Acknowledgement | How to Cite | Terms of Use | Ⓒ Rock Fracture Knowledgebase |
|||||||||||||||