Rock Fracture
KNOWLEDGEBASE
  

Scaling between Fault Length and Fault Maximum Slip

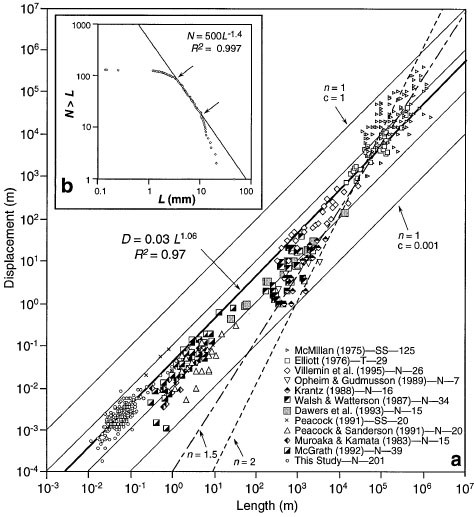
One of the studied scaling properties of faults is that between fault length and fault slip/displacement or more precisely, maximum fault slip. It is generally believed that the displacement of a fault equals the length of the fault to some exponent (n) times a constant (c). The constant c is believed to be related to rock properties and tectonic environment.

Schlische et al. (1996) collected length and displacement data on small faults at a quarry and combined their own data with the published fault population data by others. They concluded that there is a linear relationship between fault length and displacement with n about 1.06 and c about 0.03. Figure 1 shows their plot. The data sets by these authors as well as some others show the linear scaling relation between the fault length and displacement. However, the data sets show considerable scatter and divergence from a linear trend (n about 1). The authors identified several potential sources of scatter: measurement error, sampling of faults in different lithologies, effects of fault linkage and not being able to measure maximum fault length and maximum displacement. The global trend also indicates that there is no significant change in n over more than eight orders of magnitude of fault length. However, there appears to be change in the value of c that occurs at a fault length around 100 m; smaller faults generally having somewhat lower values of c than larger faults.

a: Log-log plot of displacement vs. length for various published fault populations. 'This Study' refers to Schlische (1996). Abbreviations: N, normal faults; T, thrust faults; SS, strike-slip faults. Family of linear curves (n=1) with various c values bound data; best-fit curve for only data is shown as heavy solid line. Also shown for reference are curves for n=1.5 as well as n=2. b: Size distribution of trace lengths of only faults from two-dimensional sampling of bedding surface on quarried boulder. Arrows delimit data points used to determine power-law exponent (1.4) for power-law distribution. From Schlische, et al (1996).Figure 1. a: Log-log plot of displacement vs. length for various published fault populations. 'This Study' refers to Schlische (1996). Abbreviations: N, normal faults; T, thrust faults; SS, strike-slip faults. Family of linear curves (n=1) with various c values bound data; best-fit curve for only data is shown as heavy solid line. Also shown for reference are curves for n=1.5 as well as n=2. b: Size distribution of trace lengths of only faults from two-dimensional sampling of bedding surface on quarried boulder. Arrows delimit data points used to determine power-law exponent (1.4) for power-law distribution. From Schlische, et al (1996).

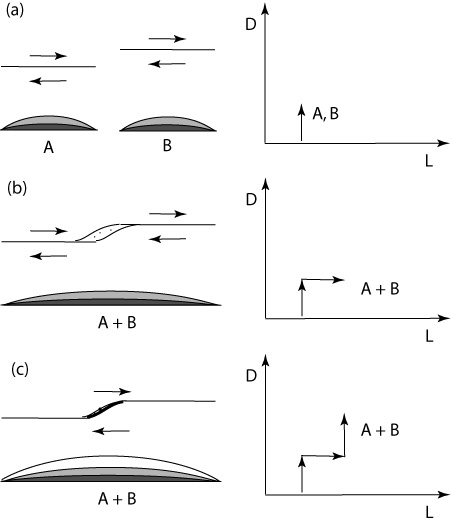
There is another explanation for the scatter based on the process of fault growth (Cartwright et al, 1995; Cowie, 1998; Gupta and Scholz, 2000). Faults grow in length by linkage of adjacent fault segments and the displacement increase during this linkage is step-like (Figure 2) where the length of the new fault roughly doubles, yet the displacement is unchanged. Hence, with further shearing, the displacement of the linked faults catches up.

Schematic illustration of evolution of fault length vs displacement ratio as the fault grows. (a) Two adjacent faults grow independently. The displacement of faults increases while fault lengths stay unchanged until a maximum displacement that can be accommodated by a given fault length. (b) Two adjacent faults linked together by splay fractures. Fault length of the linked system doubled while displacement is initially unchanged. (c) The new fault with the combined lengths can accommodate more displacement. Slightly modified from Cartwright et al (1995).Figure 2. Schematic illustration of evolution of fault length vs displacement ratio as the fault grows. (a) Two adjacent faults grow independently. The displacement of faults increases while fault lengths stay unchanged until a maximum displacement that can be accommodated by a given fault length. (b) Two adjacent faults linked together by splay fractures. Fault length of the linked system doubled while displacement is initially unchanged. (c) The new fault with the combined lengths can accommodate more displacement. Slightly modified from Cartwright et al (1995).
Reference:

Cartwright, J.A., Trudgill, B.D., Mansfield, C.S., 1995. Fault growth by segment linkage; an explanation for scatter in maximum displacement and trace length data from the Canyonlands Grabens of SE Utah. Journal of Structural Geology 17: 1319–1326.

Cowie, P.A., 1998. Normal fault growth in 3D in continental and oceanic crust. Faulting and Magmatism at Mid-Ocean Ridges, eds. R. Buck, P. Delaney, J. Karson and Y. Lagabrielle, AGU Monograph, 106.

Gupta, A., Scholz, C.H., 2000. A model of normal fault interaction based on observations and theory. Journal of Structural Geology 22 (7): 865-879.

Schlische, R., Young, S.S., Ackermann, R.V., Gupta, A., 1996. Geometry and scaling relations of a population of very small rift-related normal faults. Geology 24 (8): 683-686.


Readme    |    About Us    |    Acknowledgement    |    How to Cite    |    Terms of Use    |    Ⓒ Rock Fracture Knowledgebase