Rock Fracture
KNOWLEDGEBASE
  

Grain Size Distribution in Shear Bands

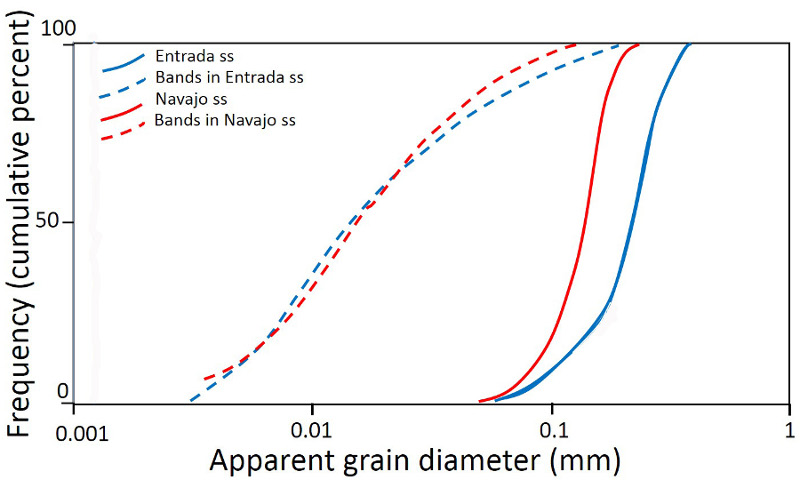
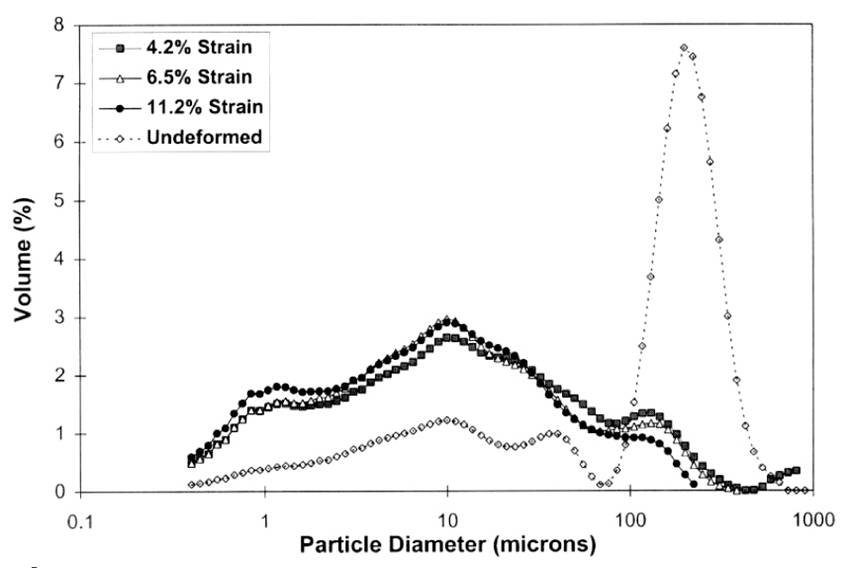
Shear bands formed by cataclastic mechanism display a significant decrease in grain size within the bands with respect to the initial grain size of the undeformed matrix and poor sorting (Figure 1). These changes associated with the comminution of grains result in a shift to smaller grain size as well as a broader range of grain size distribution within natural shear bands in sandstone (Engelder, 1974; Aydin, 1978; Aydin and Johnson, 1978). Similar trends are observed in shear bands produced in the laboratory (Mair et al., 2000) as shown in Figure 2. The grain size distribution plot in Figure 2 demonstrates also the progressive change of the grain size distribution as a function of the axial strain (up to 11.2%) to which the sample was subjected to. Shipton and Cowie (2001) characterized shear band zones and particularly grain size adjacent to slip surfaces and suggested a lower limit of grain size adjacent to them. Additional information on grain size reduction in granular rock and sediments related to shear band can be found in experimental studies such as Marone and Scholz (1989) and Crawford (1998).

Grain size distribution within cataclastic shear bands and the corresponding host rocks in which they occur, the Entrada and Navajo sandstones sampled from the surface exposures in the San Rafael Desert, Utah. The grain size in the host rocks is uniform. However, within the bands, it is poorly sorted and significantly smaller. From Aydin (1978).Figure 1. Grain size distribution within cataclastic shear bands and the corresponding host rocks in which they occur, the Entrada and Navajo sandstones sampled from the surface exposures in the San Rafael Desert, Utah. The grain size in the host rocks is uniform. However, within the bands, it is poorly sorted and significantly smaller. From Aydin (1978).
The progressive change of the grain size distribution of shear bands produced in laboratory samples as a function of the axial strains (up to 11.2%) to which the samples were subjected to. Mair et al. (2000).Figure 2. The progressive change of the grain size distribution of shear bands produced in laboratory samples as a function of the axial strains (up to 11.2%) to which the samples were subjected to. Mair et al. (2000).
Reference:

Aydin, A., Johnson, A.M., 1978. Development of faults as zones of deformation bands and as slip surfaces in sandstone. Pure and Applied Geophysics 116: 931–942.

Aydin, A., 1978. Small faults formed as deformation bands in sandstone. Pure and Applied Geophysics 16: 913-930.

Coward, M.P., Daltaban, T.S., Johnson, H., 1998. Structural geology in reservoir characterization. Geological Society of London, Special Publications 127: 27-47.

Crawford, B.R., 1998. Experimental fault sealing: shear band permeability dependency on cataclastic fault gouge characteristics. in Coward, M.P., Daltaban, T.S., and Johnson, H., eds., Structural geology in reservoir characterization: Geological Society of London, Special Publications, v. 127, p. 27-47.

Engelder, T., 1974. Cataclasis and the generation of fault gouge. Geological Society of America Bulletin 85: 1515-1522.

Mair, K., Main, I., Elphick, S., 2000. Sequential growth of deformation bands in the laboratory. Journal of Structural Geology 22: 25–42.

Marone, C., Scholz, C.H., 1989. Particle-size distribution and microstructures within simulated fault gouge. Journal of Structural Geology 11: 799-814.

Shipton, Z.K., Cowie, P.A., 2001. Damage zone and slip-surface evolution over m to km scales in highporosity Navajo Sandstone, Utah. Journal of Structural Geology 23: 1825-1844.


Readme    |    About Us    |    Acknowledgement    |    How to Cite    |    Terms of Use    |    Ⓒ Rock Fracture Knowledgebase