|
As pointed out in the link dealing with the subject of joint network scaling, joint zone networks may be characterized in a similar fashion. Figure 1 is a graph showing number of counting elements containing fracture traces (N) versus inverse of the length of the counting element side (r) for several fracture maps of the Frontier (denoted by F) and Pictured Cliffs (denoted by P) formations. According to the original author, the slope of each line is the fractal dimension, D, of the system, which ranges from 1.1 to 1.4 with an average value of 1.29.
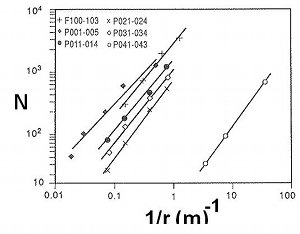 | | Figure 1. Graph showing number of counting elements containing fracture traces (N) versus inverse of length of counting element side (r) for several fracture maps of the Frontier (denoted by F 100-103) and Pictured Cliffs (denoted by P 001-043) formations. According to the original author, the slope of each line is the fractal dimension, D, of the system, which ranges from 1.1 to 1.4 with an average has of 1.29. From Laubach (1992, unpublished plot). |
| |
