Rock Fracture
KNOWLEDGEBASE
  

Pressure Solution Seam Length Distribution

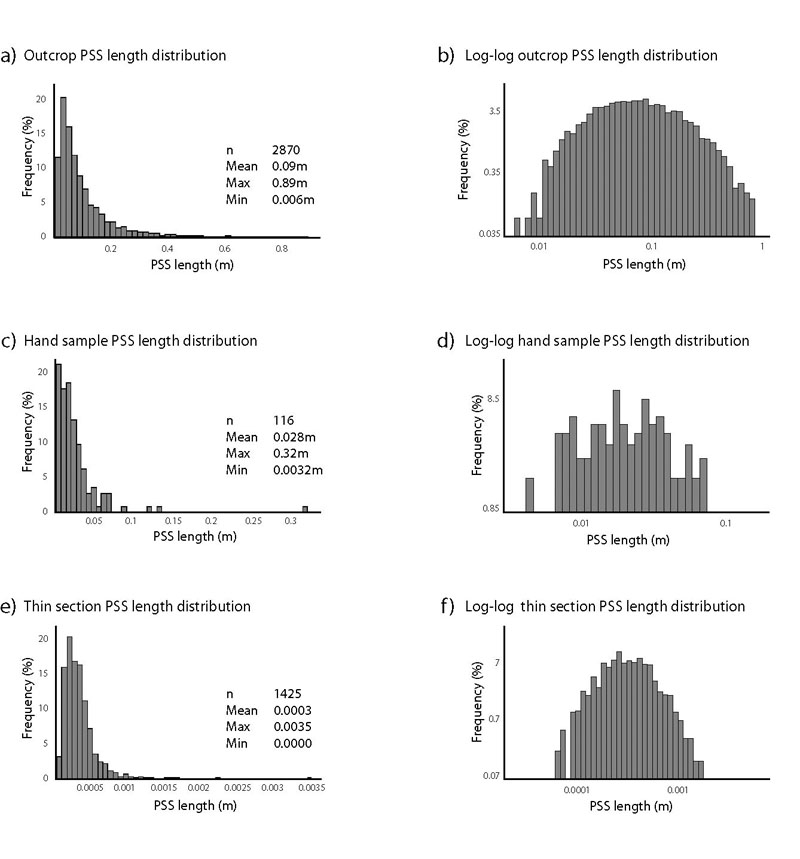
Figure 1 shows histograms of PSS length distributions at the outcrop (a-b), hand sample (c-d), and thin section (e-f) scale from a sandstone formation (Nenna et al., 2012). All magnitudes of lengths are less than 10 meters.

Histograms showing frequency-length distribution of the pressure solution seams measured at three different scales: outcrop (a, b), a cut and polished surface of a hand sample (c, d), and a thin section image (e, f). The log-log plots on the right hand side (b, d, f) suggest the distributions are not log-normal but hyperbolic in form. From Nenna et al. (2012).Figure 1. Histograms showing frequency-length distribution of the pressure solution seams measured at three different scales: outcrop (a, b), a cut and polished surface of a hand sample (c, d), and a thin section image (e, f). The log-log plots on the right hand side (b, d, f) suggest the distributions are not log-normal but hyperbolic in form. From Nenna et al. (2012).

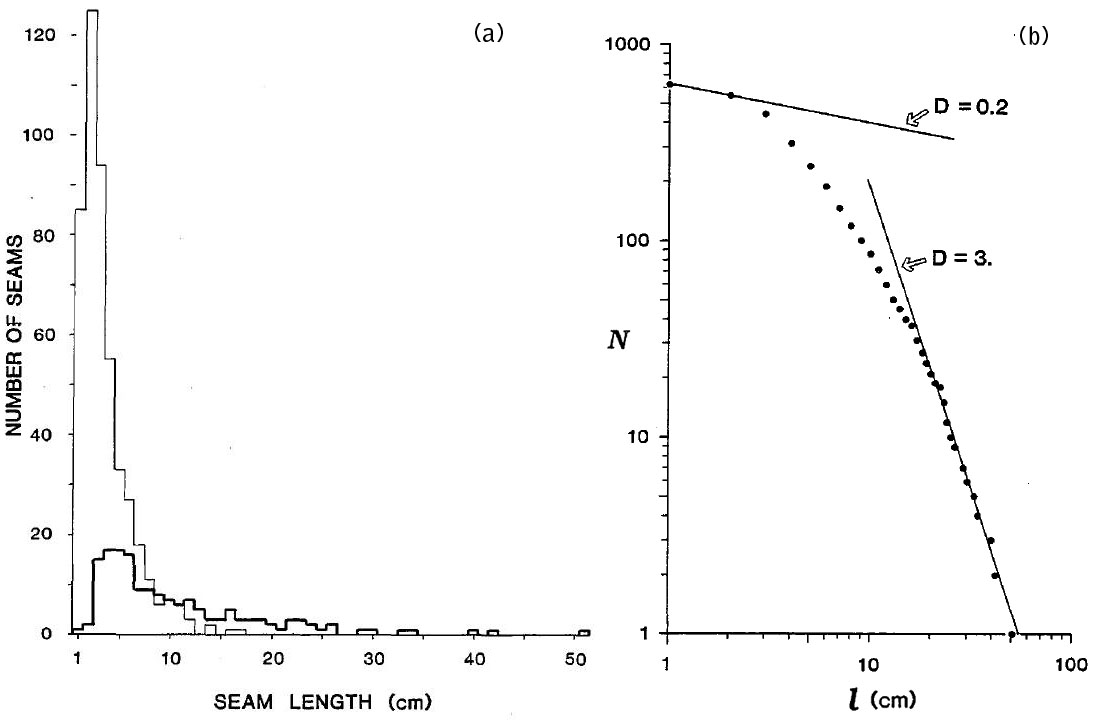
Mardon (1988) has reported maximum lengths from PSSs in limestone exposed in the Appalachians, Pennsylvania, USA (Figure 2) even smaller than that of Nenna et al.

(a) Frequency-length distribution of pressure solution seams in limestone outcrops. Thin lines are for single seams and thick lines are for composite seams. (b) Number N of seams longer than l plotted as a function of seam length l. Data shown are for only complete seams on the outcrop map and include both histograms in (a). Data distributed along a smooth curve whose slope can be interpreted as a fractal dimension, D. D varies from 0.2 to about 3, as l goes from 1 cm to 17 cm. D = 3 is a constant for l > 17 cm seams. From Mardon (1988).Figure 2. (a) Frequency-length distribution of pressure solution seams in limestone outcrops. Thin lines are for single seams and thick lines are for composite seams. (b) Number N of seams longer than l plotted as a function of seam length l. Data shown are for only complete seams on the outcrop map and include both histograms in (a). Data distributed along a smooth curve whose slope can be interpreted as a fractal dimension, D. D varies from 0.2 to about 3, as l goes from 1 cm to 17 cm. D = 3 is a constant for l > 17 cm seams. From Mardon (1988).

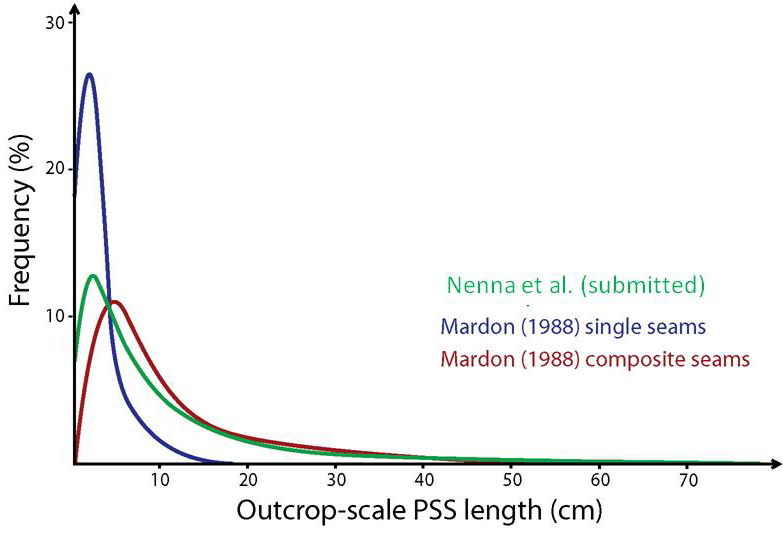
However, Safarics and Davison (2005) reported stylolitic seams longer than 800 m in limestone exposed at Flambrough (UK) but no data set and criterion for identification of 'a single seam' was provided by these authors.

The log-log plots for the data sets by Nenna et al. (Figures 1 (b), (d), (f)) suggest that the distributions are hyperbolic in form rather than log-normal, which is highly unusual. We note that the data sets in Figures 1 (a), (c), (e) would commonly be interpreted as log-normal in the literature on the fracture statistical distribution forms. For comparison, Figure 3 shows the length-frequency plots from Nenna et al. (submitted) and from Mardon (1988) for single and composite PSSs.

Comparison of outcrop length distributions of PSSs in sandstone (Nenna et al., 2012) and in limestone (Mardon, 1988).Figure 3. Comparison of outcrop length distributions of PSSs in sandstone (Nenna et al., 2012) and in limestone (Mardon, 1988).
Reference:

Mardon, D., 1988. Localized pressure solution and the formation of discrete solution seams. Ph.D. thesis, College Station, Texas A and M University, Texas, USA.

Nenna, F., Zhou, X., Aydin, A., 2012. Spatial statistical properties of pressure solution seams in clastic rocks in southwest Ireland. Mathematical Geosciences 44: 595-617, doi: 10.1007/s11004-012-9407-4.

Safaricz, M., Davison, I., 2005. Pressure solution in chalk. American Association of Petroleum Geologists Bulletin 89 (3): 383-401.


Readme    |    About Us    |    Acknowledgement    |    How to Cite    |    Terms of Use    |    Ⓒ Rock Fracture Knowledgebase