| |||||||
|
|
|||||||
|
|
|||||||
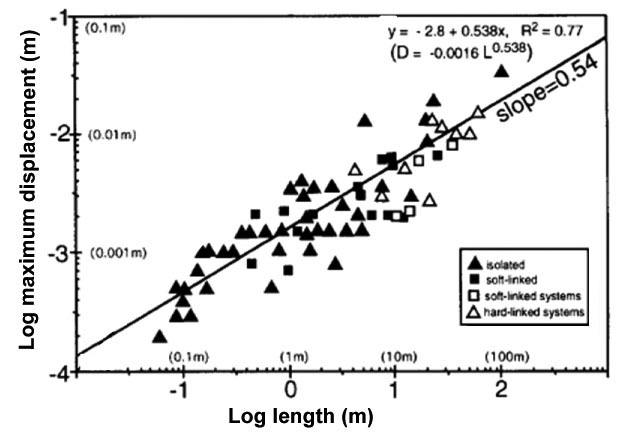
| Shear Band Zone Length - Displacement Scaling | |||||||
|
All the available data sets show that the maximum displacements are related linearly to the band lengths. Figure 1 is from a particular host rock (Entrada Sandstone) and a particularly well-studied location (San Rafael Desert, southeastern Utah). In the plot the best fit line has a slope or exponent of 0.54 for the isolated bands (Fossen and Hesthammer, 1997). The soft- and hard-linked bands have more-or-less similar trends. The data compiled from different sandstones by different investigators suggest that the shear bands of various types have different linear trends. In general, the shear bands with cataclastic micromechanics appear to have lower displacement values and lower displacement/length gradients (Fossen et al. 2007).
| |||||||
| Reference: |
|||||||
| Fossen, H., Hesthammer, J., 1997 Fossen, H., Schultz, R.A., Shipton, Z.K., Mair, K., 2007 |
|||||||
|
Readme | About Us | Acknowledgement | How to Cite | Terms of Use | Ⓒ Rock Fracture Knowledgebase |
|||||||