Rock Fracture
KNOWLEDGEBASE
  

Faulting by Shearing of Vein and Pressure Solution Seam Assemblages

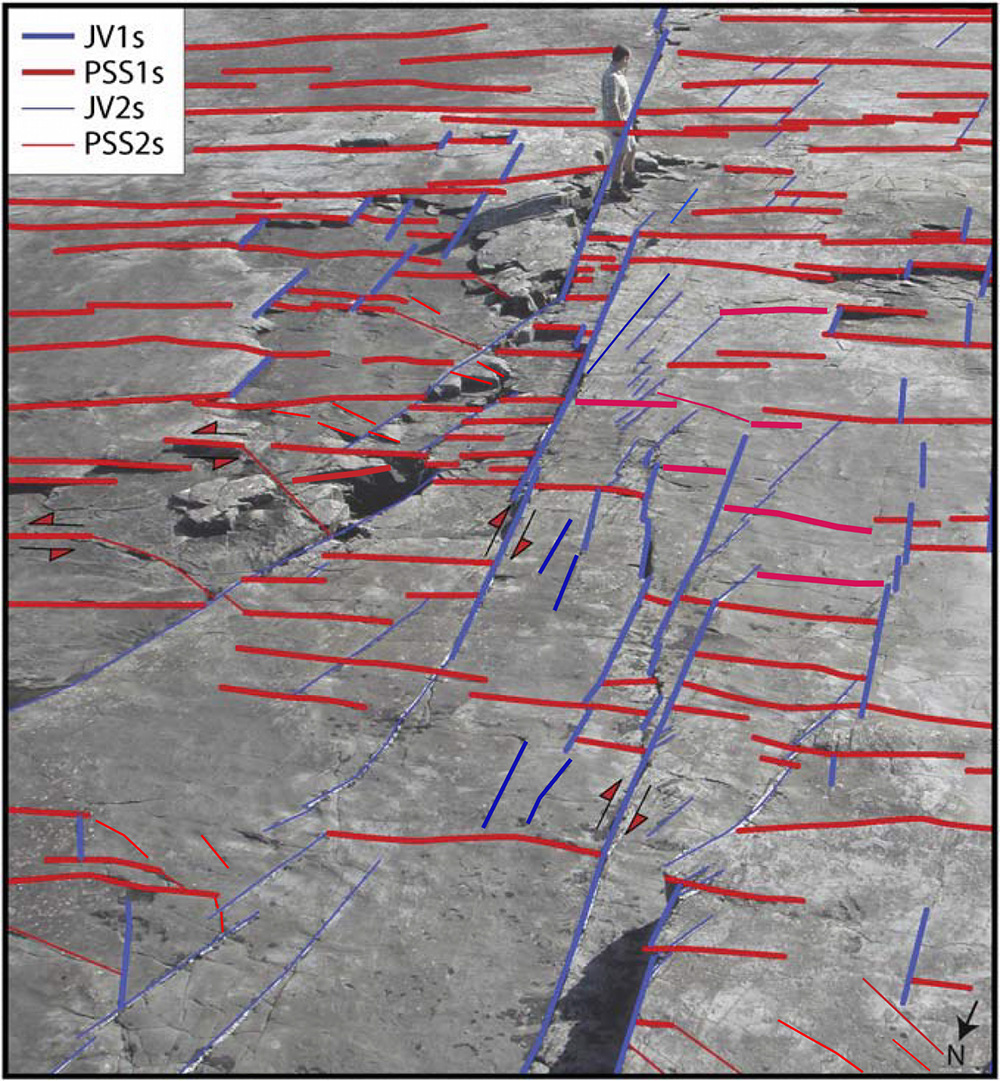
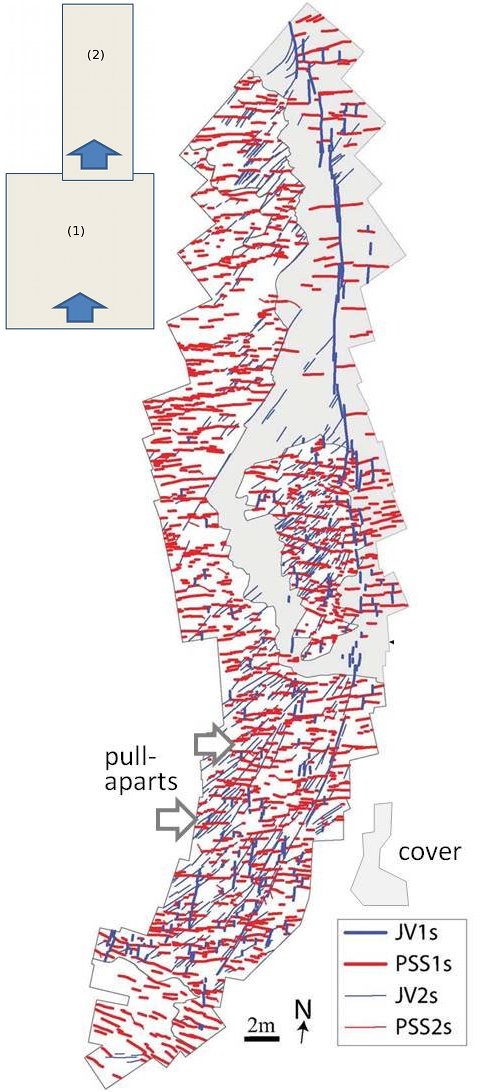
There is a wide variety of configurations including pressure solution seams and veins, the shearing of which produces faults with a complex geometry. Perhaps one of the readily recognizable scenarios is that of shearing of orthogonal veins and pressure solution seams. Figure 1 shows such a case which was mapped on an oblique photograph of a sandstone platform taken from a higher mesa nearby. Thicker red lines are E-W trending pressure solution seams (PSS1) with splays (thin red lines-PSS2) when sheared in a left-lateral sense. Thicker blue lines are N-S trending quartz-filled veins (JV1) with splay veins (thin blue lines-JV2) when sheared in a right-lateral sense. Man for scale in the photo is Fil Nenna standing by the southernmost segment of the fault where the measured right-lateral slip is about 40 cm across the sheared vein. Further down south is the end of the southernmost large segment of the fault with numerous splay veins fanning out from the terminations of the sheared shorter echelon veins (Figure 2).

Two orthogonal sets of pressure solution seams (PSS1-thick red lines) and joints or veins (JV1-thick blue lines), the left- and right-lateral shearing, respectively, of which resulted in splay pressure solution seams (PSS2-thin red lines) and joints or veins (JV2-thin blue lines) at acute angle to the initial orthogonal arrays. Person for scale on the photo is Fil Nenna who is standing by the southernmost segment of the fault where the slip is predominantly right-lateral of about 40 cm. View due south. Slightly modified from Nenna and Aydin (2011).Figure 1. Two orthogonal sets of pressure solution seams (PSS1-thick red lines) and joints or veins (JV1-thick blue lines), the left- and right-lateral shearing, respectively, of which resulted in splay pressure solution seams (PSS2-thin red lines) and joints or veins (JV2-thin blue lines) at acute angle to the initial orthogonal arrays. Person for scale on the photo is Fil Nenna who is standing by the southernmost segment of the fault where the slip is predominantly right-lateral of about 40 cm. View due south. Slightly modified from Nenna and Aydin (2011).
Map of the southern end of the southernmost sheared vein segment in Figure 1 showing a complex interplay between the splay veins (JV1), sheared pressure solution seams (PSS1), and splay pressure solution seams (PSS2). Arrows point out two of numerous pull-aparts such as those shown in Figure 3. From Nenna and Aydin (2011).Figure 2. Map of the southern end of the southernmost sheared vein segment in Figure 1 showing a complex interplay between the splay veins (JV1), sheared pressure solution seams (PSS1), and splay pressure solution seams (PSS2). Arrows point out two of numerous pull-aparts such as those shown in Figure 3. From Nenna and Aydin (2011).

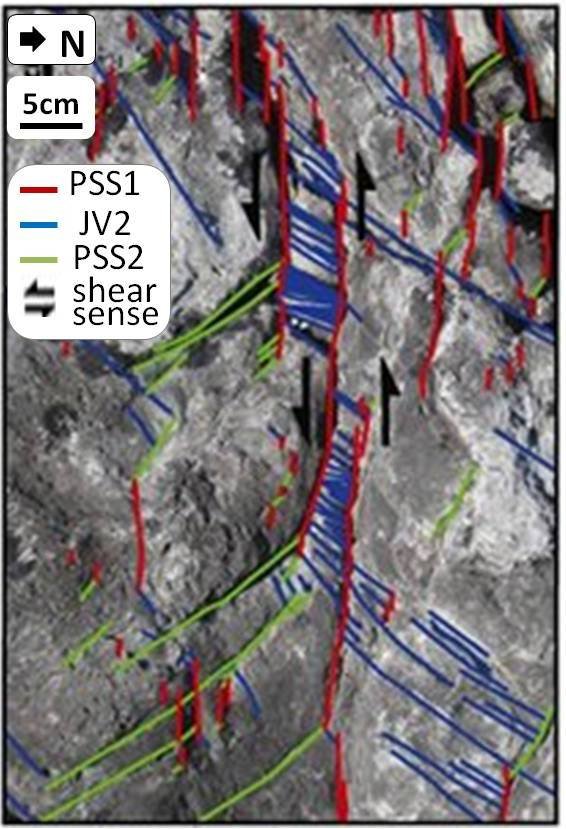
Perhaps the most interesting deduction from the fans of splay veins (JV2) which are localized at the pull-aparts between the sheared pressure solution seams (PSS1) is that not only are they contemporaneous but also shearing of the PSS1 and propagation of JV2 and, consequently, shearing of JV1, were all harmonious (Figure 3).

Details of interplay between splay veins (JV2) and sheared pressure solution seams (PSS1) and splay pressure solution seams (PSS2). Based on these relationships, it can be inferred that these structures and initial joints and veins (JV1) were deforming in harmony at the same time. View due east. From Nenna and Aydin (2011).Figure 3. Details of interplay between splay veins (JV2) and sheared pressure solution seams (PSS1) and splay pressure solution seams (PSS2). Based on these relationships, it can be inferred that these structures and initial joints and veins (JV1) were deforming in harmony at the same time. View due east. From Nenna and Aydin (2011).

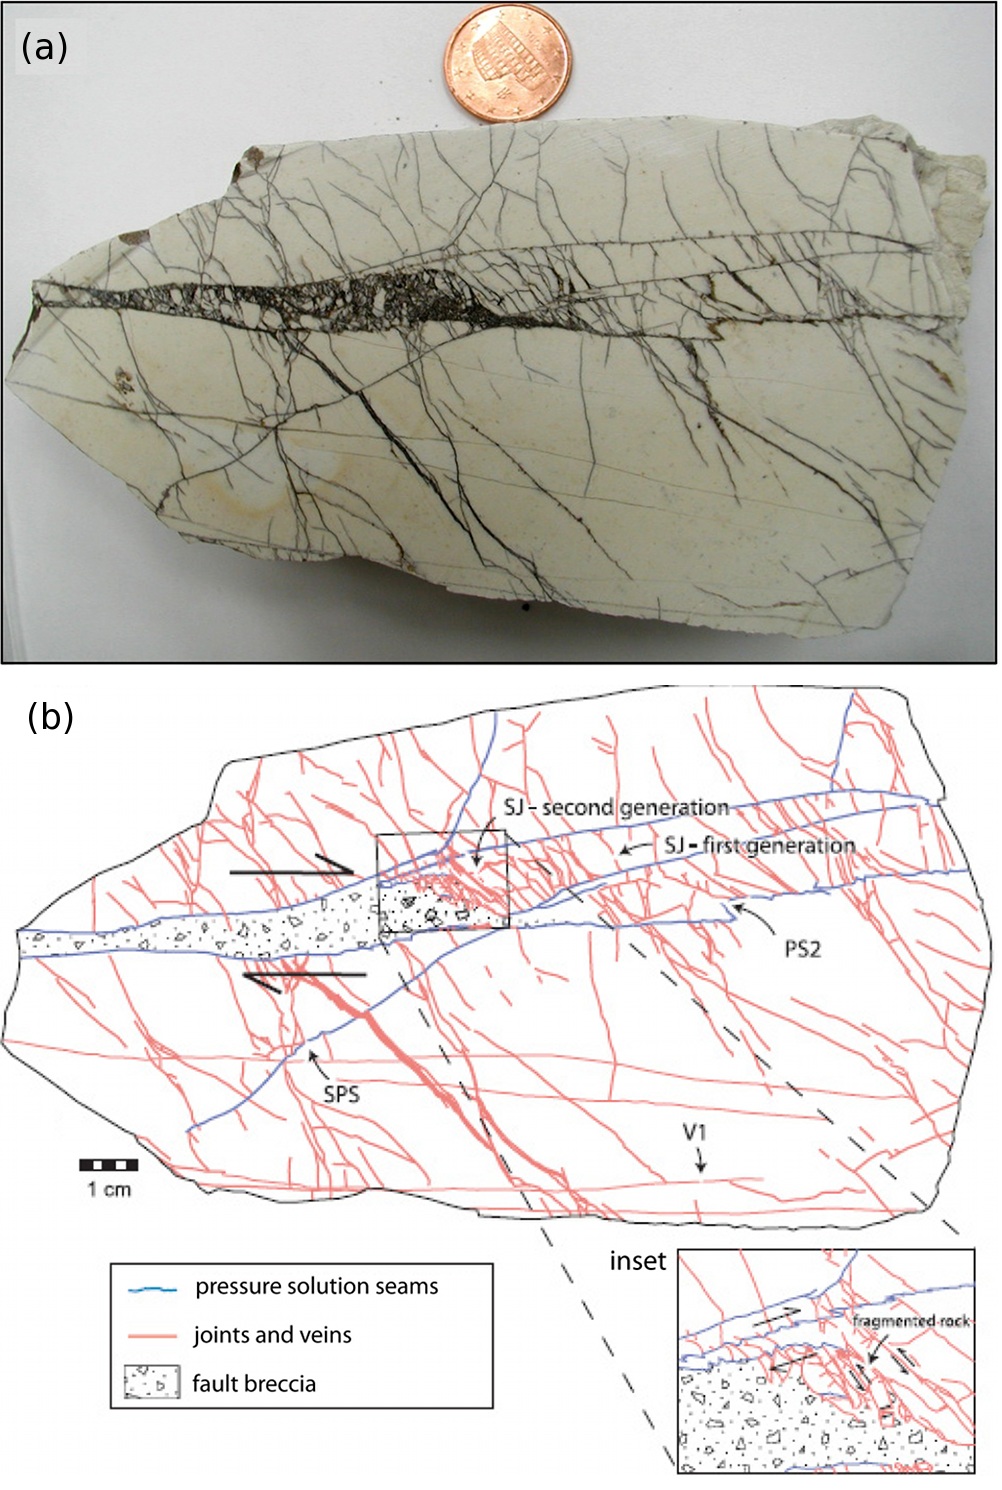
Figures 4 and 5 display a similar deformation style in limestone where a thin breccia zone filled by tar marks the fault zone. The inset in Figure 5b shows the details of the occurrence of a high density of splay veins between sub-parallel sheared seams thereby fragmenting the rock and initiating brecciation.

Map showing two sets of orthogonal veins and pressure solution seams, red and blue lines, respectively, on a limestone pavement cropping out at the Albanite Fold and Thrust Belt. Some of these structures were sheared to produce small faults with slip on the order of a few centimeters. One of these small faults (black lines) is marked on the map. Note the hammer on the lower right quadrant for scale. From Graham Wall et al. 2006.Figure 4. Map showing two sets of orthogonal veins and pressure solution seams, red and blue lines, respectively, on a limestone pavement cropping out at the Albanite Fold and Thrust Belt. Some of these structures were sheared to produce small faults with slip on the order of a few centimeters. One of these small faults (black lines) is marked on the map. Note the hammer on the lower right quadrant for scale. From Graham Wall et al. 2006.
Photograph (a) and map (b) of a cut and polished surface showing an incipient fault with about 2 cm right-lateral slip. The fault zone is marked by a breccia zone filled by tar. The map shows that both pressure solution seams (blue lines) and veins (red lines) were sheared in right- and left-lateral sense, respectively. The formation of the breccia within the fault zone by progressive fragmentation of rock is associated with a high density of splay veins (consistent with the left-lateral shearing of the bounding seams) as seen in the inset.  From Graham Wall et al. 2006.Figure 5. Photograph (a) and map (b) of a cut and polished surface showing an incipient fault with about 2 cm right-lateral slip. The fault zone is marked by a breccia zone filled by tar. The map shows that both pressure solution seams (blue lines) and veins (red lines) were sheared in right- and left-lateral sense, respectively. The formation of the breccia within the fault zone by progressive fragmentation of rock is associated with a high density of splay veins (consistent with the left-lateral shearing of the bounding seams) as seen in the inset. From Graham Wall et al. 2006.

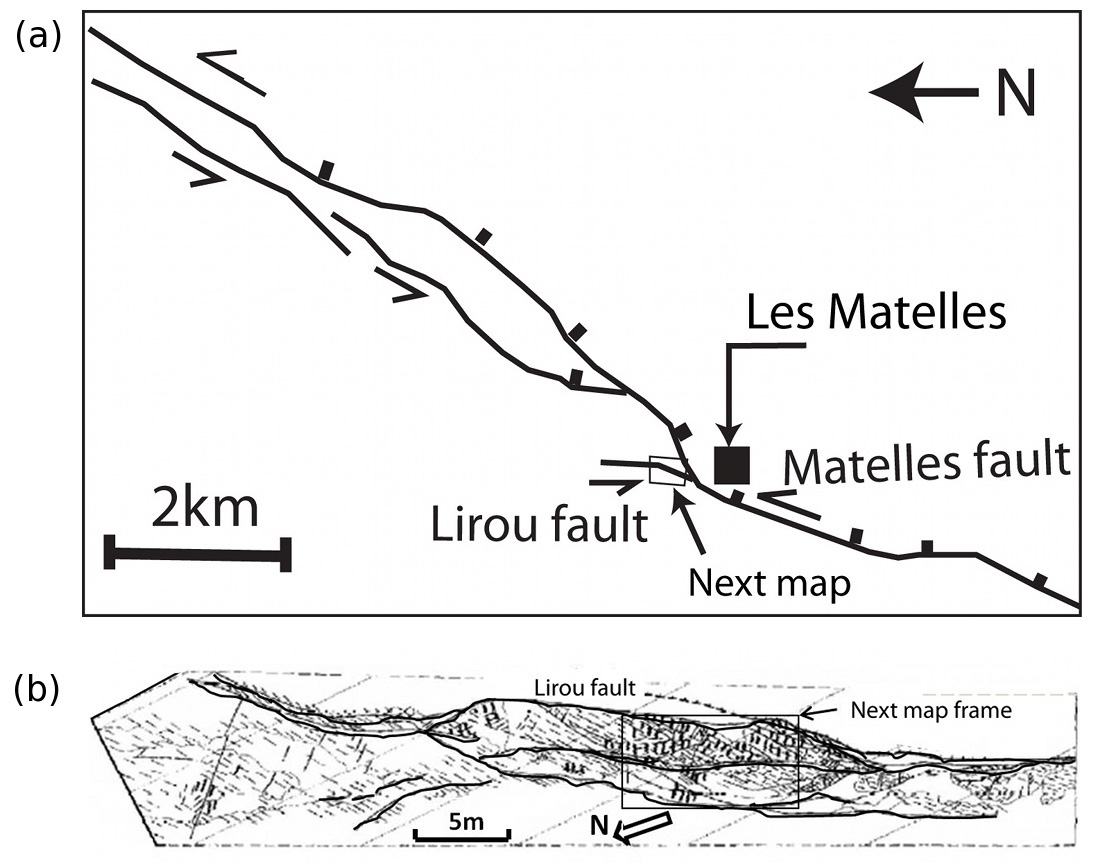
Also common in nature is a process of shearing of either veins or pressure solution seams producing both veins and seams as splays. Perhaps one of the most impressive examples of this type of assemblages is that of a well-documented case from the Jurassic limestone cropping out in Lanquedoc, France (Rispoli, 1981; Petit and Mattahauer, 1995; Watkinson and Ward, 2006). Here, the largest structure is a series of left-lateral strike-slip faults, the southernmost strand of which is the Matelles fault (Figure 6a) attributed to the Upper Eocene Pyrenean shortening. There are also normal-slip faults in the area, for example, the Lirou fault (Figures 6a and b), and the normal slip is attributed to the Oligocene extension.

(a) A series of faults with predominantly strike-slip and some strands with normal slip component in Jurassic limestone cropping out near Les Matelles in Lanquedoc, France. Note the location of the next map along the Lirou fault strand. Simplified from Petit and Mattauer (1995). (b) Map showing the major strands of the Matelles-Lirou predominantly strike-slip fault system with some normal slip components. Rectangle in the upper center marks the frame of the next map. From Petit and Mattauer (1995). Note that the major strands are highlighted by thick black lines for the purpose of better visibility.Figure 6. (a) A series of faults with predominantly strike-slip and some strands with normal slip component in Jurassic limestone cropping out near Les Matelles in Lanquedoc, France. Note the location of the next map along the Lirou fault strand. Simplified from Petit and Mattauer (1995). (b) Map showing the major strands of the Matelles-Lirou predominantly strike-slip fault system with some normal slip components. Rectangle in the upper center marks the frame of the next map. From Petit and Mattauer (1995). Note that the major strands are highlighted by thick black lines for the purpose of better visibility.

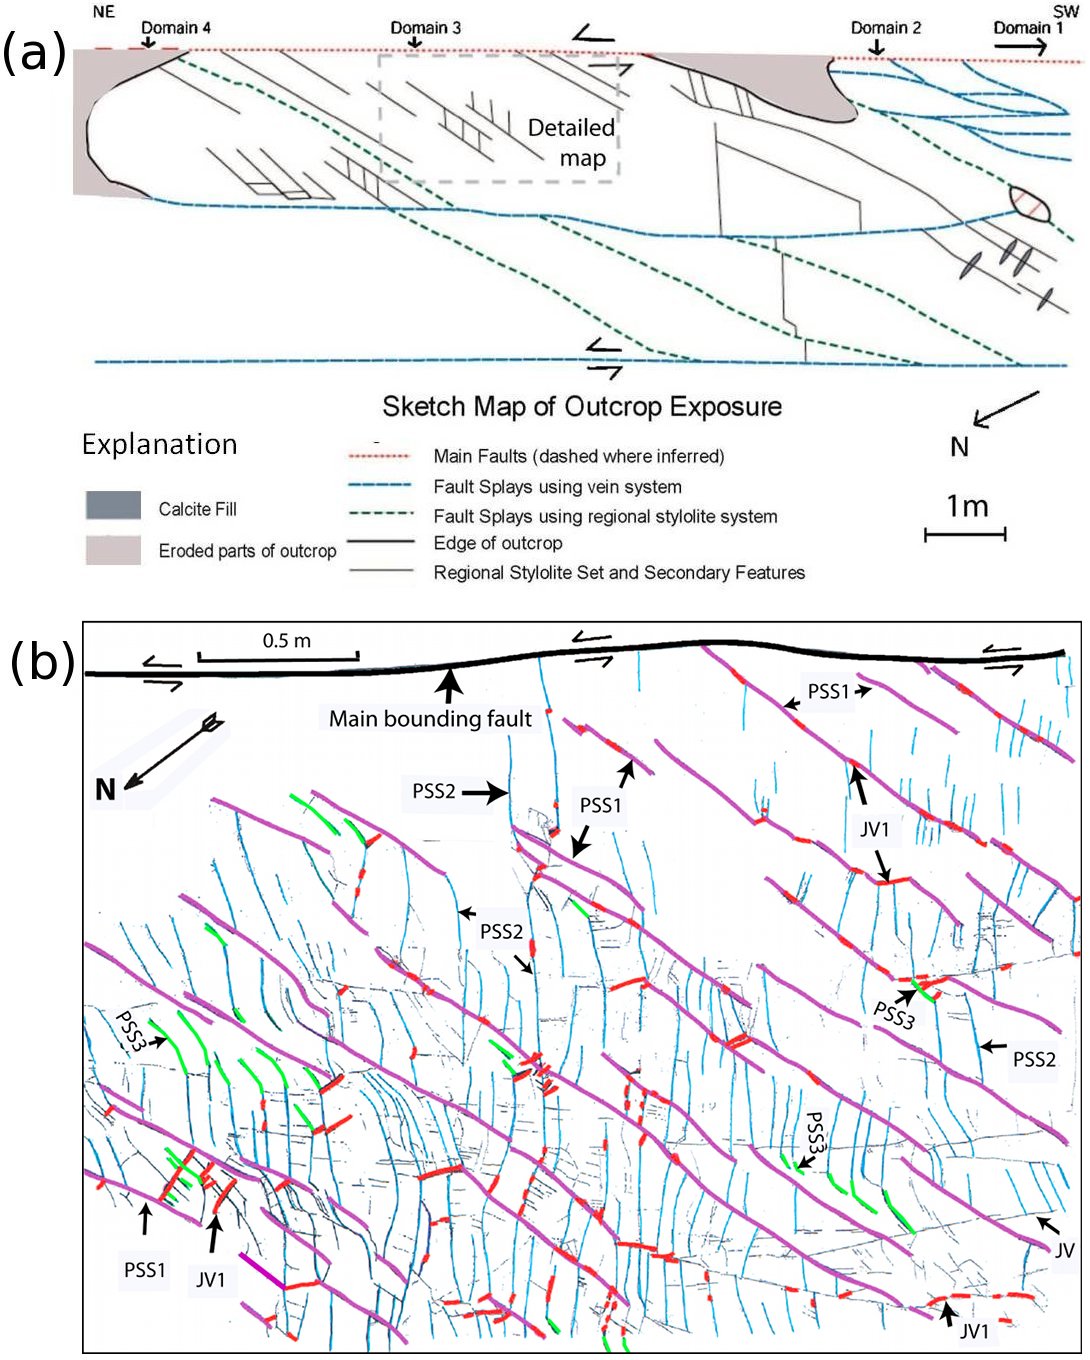
A field sketch of an area identified in Figure 6b and a highly detailed map accomplished by 1:1 scale mapping are shown in Figures 7a and b, respectively. One of the left-lateral fault strands is marked as the main bounding fault in Figure 7b. According to Petit and Mattahauer (1995), this fault was formed by shearing of a pre-existing vein array. In fact, both Figures 6 and 7 have evidence of sheared veins sub-parallel to the bounding fault. The bounding fault is accompanied by a system of pressure solution seams (from oldest to youngest, PSS1 and PSS2, and PSS3) of which at least the two older generations were sheared. This deformation is also accompanied by a system of joints and veins JV1. The JV1 is actually more than one set of veins, some of which occur by opening of earlier pressure solution seams and veins and some others occur as short splays associated with the shearing of the pressure solution seam sets. Also marked as JV is a set of joints and veins, the age of which is ambiguous. Please note that PS3 becomes more-or-less parallel to PS1.

(a) Field sketch showing the Matelles-Lirou fault system and related associated small-scale structures. (b) Detailed map (scale 1:1) of a network of pressure solution seams and their sequential splaying and shearing adjacent to the bounding fault. From older to younger, PSS1 (purple), PSS2 (blue), and PSS3 (green) represent three generations of pressure solution seams, the former two of which were sheared in left- and right-lateral sense, respectively. Note that the PSS3 set are the youngest splays and are sub-parallel to PSS1. The short red lines represent calcite veins which are associated with the gaps and pull-aparts along commonly PSS1s and occasionally PSS2s. Thin black lines (marked as JV) are veins with ambiguous abutting relationships. There are also those veins (JV1-thick red lines) forming along, and as splays, generally of the pressure solution sets. From Watkinson and Ward (2006).Figure 7. (a) Field sketch showing the Matelles-Lirou fault system and related associated small-scale structures. (b) Detailed map (scale 1:1) of a network of pressure solution seams and their sequential splaying and shearing adjacent to the bounding fault. From older to younger, PSS1 (purple), PSS2 (blue), and PSS3 (green) represent three generations of pressure solution seams, the former two of which were sheared in left- and right-lateral sense, respectively. Note that the PSS3 set are the youngest splays and are sub-parallel to PSS1. The short red lines represent calcite veins which are associated with the gaps and pull-aparts along commonly PSS1s and occasionally PSS2s. Thin black lines (marked as JV) are veins with ambiguous abutting relationships. There are also those veins (JV1-thick red lines) forming along, and as splays, generally of the pressure solution sets. From Watkinson and Ward (2006).

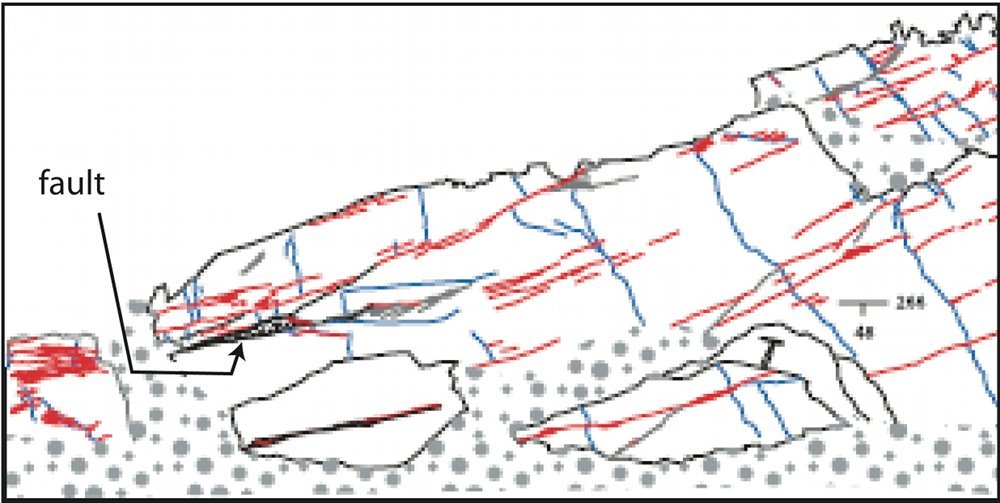
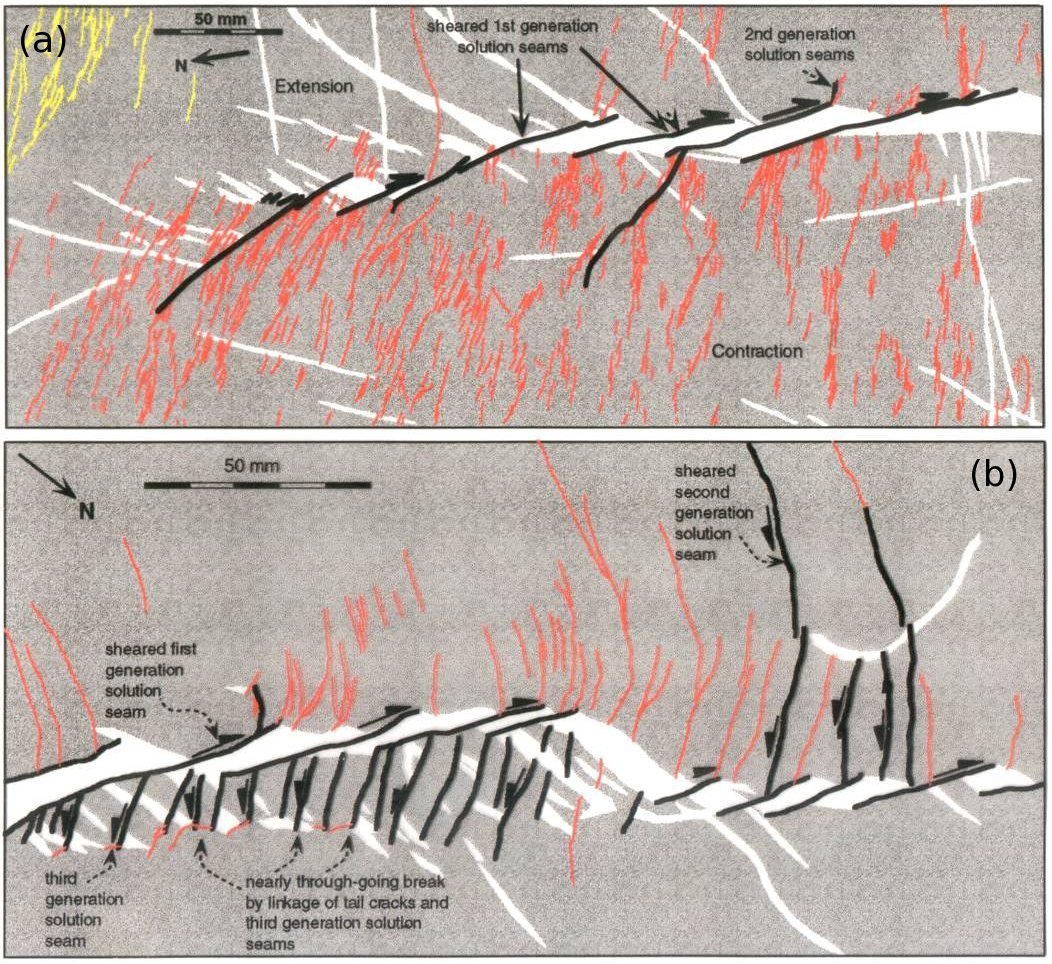
A case somewhat similar to the one in the Lanquedoc area is fault development in the Jurassic limestone cropping out in the Bristol Channel (Peacock and Sanderson, 1995; Willemse et al., 1997). Figures 8a and b are detailed maps of two fault zones formed by initial opening across an echelon array of veins and formation of pressure solution seams at high-angle to the veins, which were subsequently sheared in a sense dictated by the opening across the veins.

Arrays of two faults (a and b) and the associated structures of both veins (white)and pressure solution seams (red lines) in limestone cropping out at the Bristol Channel, Great Britain. The pressure solution seams were sheared in right- and left-lateral sense (black). Also note that the splays of the second generation faults are sub-parallel to the first generation faults. From Willemse et al. (1997).Figure 8. Arrays of two faults (a and b) and the associated structures of both veins (white)and pressure solution seams (red lines) in limestone cropping out at the Bristol Channel, Great Britain. The pressure solution seams were sheared in right- and left-lateral sense (black). Also note that the splays of the second generation faults are sub-parallel to the first generation faults. From Willemse et al. (1997).

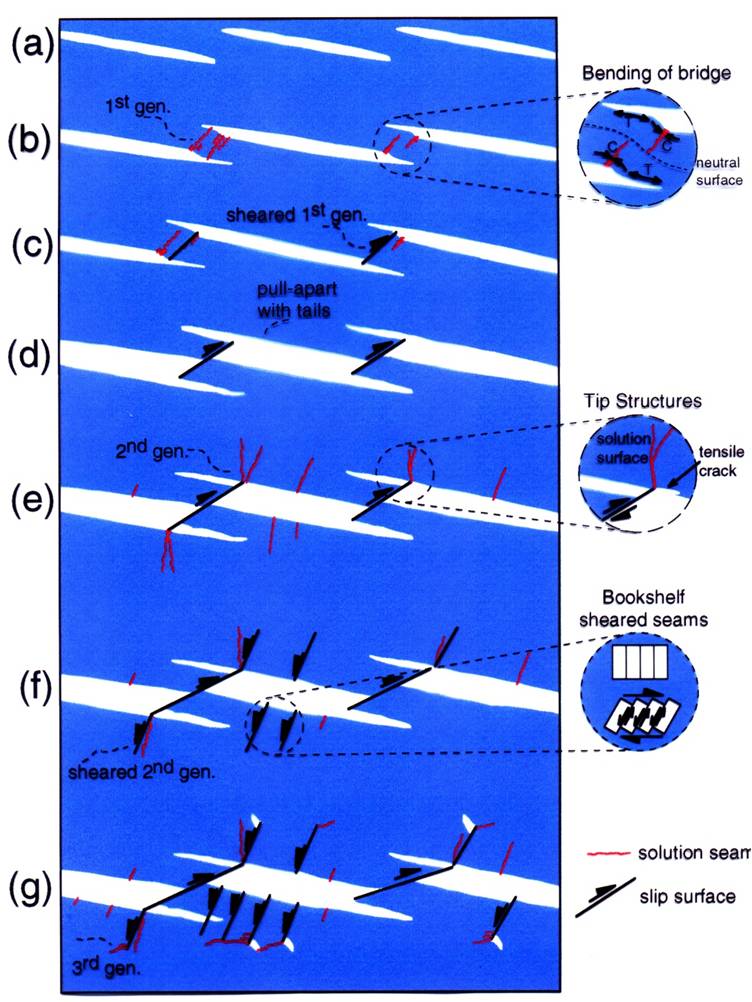
Figure 9 is a series of diagrams based on 1:1 scale mapping of the traces of assemblages to illustrate the formation of incrementally larger faults. Here the initial pressure solution seams were localized at the steps between echelon veins, the shape of which enhances the stress concentration leading to the initial pressure solution seams. Figure 9 (a) shows the initial stage of en echelon veins; (b) the development of two symmetrically arranged zones of solution seams in the contractional arches of the bending bridge; (c) the incipient pull-aparts form because of shear along the solution seams; (d) shows continued shear along first-generation solution seams leading to the development of pull-aparts; (e) second generation of solution seams, as well as tail cracks, form at the tips of sheared first-generation solution surfaces; (f) antithetic slip occurring along second-generation solution seams oriented at a high angle to the fault zone; (g) the third generation of solution seams, as well as tail cracks at the tips of the sheared second generation solution seams, forming a complex anastomosing network of discontinuities across the fault zone; (h) the solution seams and en echelon veins forming in a contractional relay ramp between two side-stepping fault segments; (i) synthetic and antithetic slip along the solution seams and en echelon veins causing the formation of opening-mode tail cracks and solution seams, progressively fragmenting the relay ramp. A through-going fault may eventually develop along the fourth generation of solution seams, linking both fault segments.

Schematic model for the development of a single fault-zone. Redrawn from Willemse et al. (1996).Figure 9. Schematic model for the development of a single fault-zone. Redrawn from Willemse et al. (1996).
Reference:

Nenna, F., Aydin, A., 2011. The role of pressure solution seam and joint assemblages in the formation of strike-slip and thrust faults in a compressive tectonic setting; the Variscan of southwestern Ireland. Journal of Structural Geology 33: 1595-1610, doi:10.1016/ j.jsg.2011.09.003.

Peacock, D.C.P., Sanderson, D.J., 1995. Pull-aparts, shear fractures and pressure solution. Tectonophysics 241: 1–13.

Petit, J.P., Mattauer, M., 1995. Palaeostress superimposition deduced from mesoscale structures in limestone: the Matelles exposure, Languedoc, France. Journal of Structural Geology 17 (2): 245-256.

Watkinson, A.J., Ward, E.M.G., 2006. Reactivation of pressure-solution seams by a strike-slip fault-sequential, dilational jog formation and fluid flow. American Association of Petroleum Geologists Bulletin 90 (8): 1187–1200.

Willemse, E.J.M, Pollard, D.D., Aydin, A., 1996. Analysis of the relationship between slip distribution and 3D echelon fault geometry with consequences for fault scaling. Journal of Structural Geology 18 (2-3): 295-309.

Willemse, E.J.M, Peacock, D.C.P., Aydin, A., 1997. Nucleation and growth of strike-slip faults in limestones from Somerset, UK. Journal of Structural Geology 19 (12): 1461-1477.


Readme    |    About Us    |    Acknowledgement    |    How to Cite    |    Terms of Use    |    Ⓒ Rock Fracture Knowledgebase