|
Isolation and enlargements of parts of the map in Figure 2 in the section entitled 'Compaction Band Domains' showing distribution of dunes numbered as D1, D2, etc. and color-coded compaction band domains from parts of the map are presented in Figure 1(a) and Figure 1(b). These maps show clearly that there exist multiple compaction band domains in a single dune (a) and sometimes an entire dune contains only one single compaction band domain (b). Deng and Aydin (2012) proposed that the orientation of the cross-beds and its variation control the presence and orientation of compaction bands and their patterns. Figure 2 shows the plot of cross-bed orientations with and without bed-parallel compaction bands (a) and with or without compaction bands at high-angle to cross-beds (b).
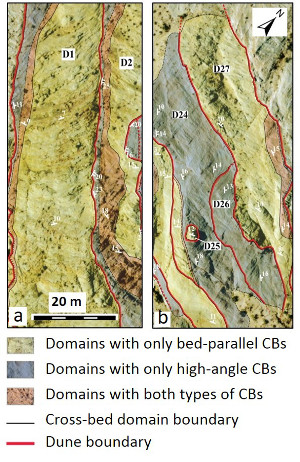 | | Figure 1. Details of compaction band domains in dunes at Valley of Fire State Park, Nevada. (a) Multiple compaction band domains in single dunes labeled D1 and D2. (b) More complex relationships showing single domains in one dune and variation of domains in neighboring dunes. Note that traces of cross-beds appear as faint lineations. From Deng and Aydin (2015). |
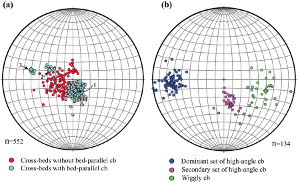 | | Figure 2. Stereo net plots of cross-bed orientations with (turquoise) and without (red) bed-parallel compaction bands (a) and two sets of compaction bands at high-angle to cross-bedding (b). (1), (2), and (3) are three clusters of bed-parallel compaction bands, Bp1, Bp2, and Bp3 with the squares marking their mean values. Data marked by blue in (b) represent dominant high-angle compaction bands (H1). Wiggly bands (green) in (b) are average orientations of splay bands. From Deng and Aydin (2012). |
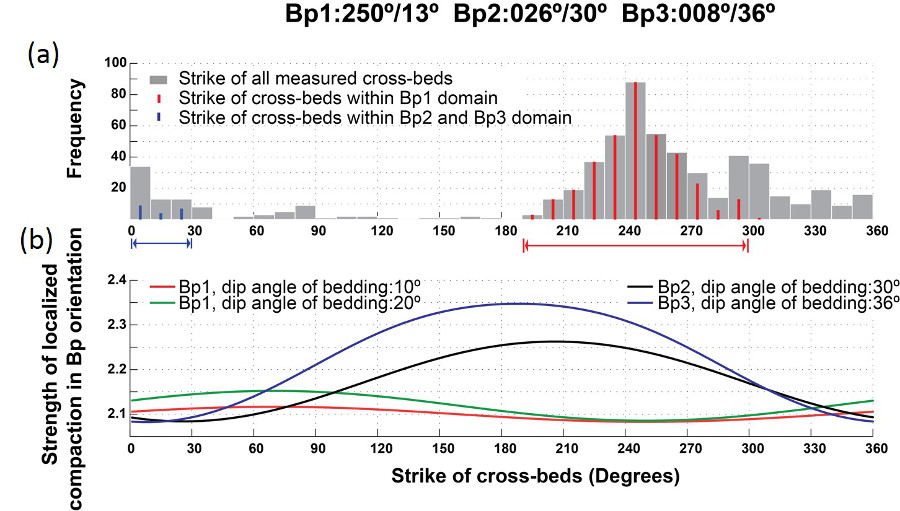
Deng and Aydin (2015) in a follow-up paper used a quadratic failure criterion (given in compact form on the top of Figure 3) which was developed by Tsai and Wu (1971) for transversely isotropic materials to investigate the potential relationship between strength of localized compaction in layered material (Figure 3). Figure 4 shows strength of localized compaction (normalized by that of uniaxial compression normal to the bedding) for cross-bed orientations Bp1 250°/13°, Bp2 026°/13°, and Bp3 008°/36°. These values are chosen based on the field data on the presence of bed-parallel compaction bands along the cross-beds in these orientations. Figure 4(a) shows strike of cross-beds with two ranges corresponding to the main categories (Bp1, Bp2, and Bp3) and Figure 4(b) shows the strength of localized compaction for different cross-bed dip values, again based on the field observations. For the lower dip-angle group (10° and 20°), the strike of cross-bed range falls between 210° and 270°. In contrast, for the higher dip-angle group (30° and 36°), it is between 0° and 30° and 330° and 360°. The field observations match the model results quite well.
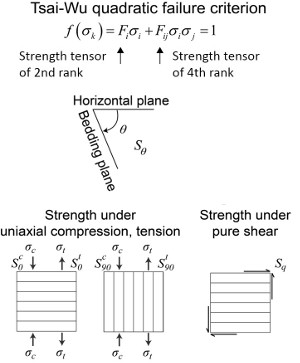 | | Figure 3. Tsai-Wu failure criterion, a quadratic equation including 2nd and 4th ranked strength tensors. Bedding planes are defined by dip angle theta and the strength (S) under uniaxial compression (sigma c) and tension (sigma t) and strength terms for loading perpendicular (S 0) and parallel (S 90) to bedding and strength for pure shear (Sq) are shown. From Deng and Aydin (2015). |
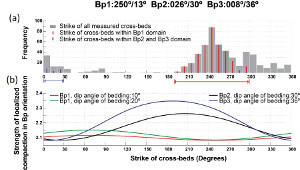 | | Figure 4. (a) Measured orientation of cross-beds with compaction bands Bp1, Bp2, and Bp3. (b) Calculated strength of localized compaction (normalized by the strength under bed-perpendicular compressive) for cross-bedding with different dip angles. Lower values of strength of localized compression correspond to higher concentration of observed bed-parallel compaction (blue and red arrows). From Deng and Aydin (2015). |
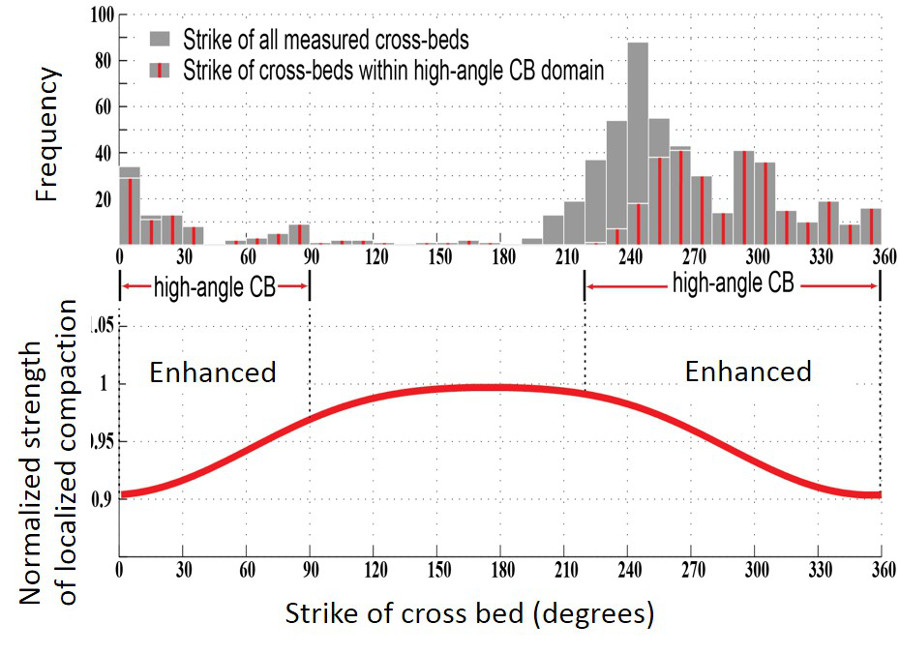
Figures 5(a) and (b) show the plot of the observed field data (a) and the calculated model results (b) for high-angle to bedding compaction bands and normalized strength of localized compaction with respect to the attitude of the cross-beds with and without the high-angle compaction bands. The enhanced ranges (double arrows) indicated by relatively lower strength values match well with the observed distribution of high-angle compaction bands in high frequency.
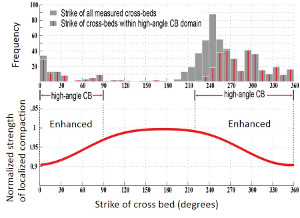 | | Figure 5. (a) Strike of only measured cross-beds (gray) and strike of cross-beds with high-angle to bedding compaction bands (red center line). (b) Calculated strength of localized compaction in the orientation of the dominant high-angle bands (H1). Lower values of the calculated strength matches well the measured strikes of the high-angle compaction bands. From Deng and Aydin (2015). |
| |
Deng, S., Aydin, A., 2012. Distribution of compaction bands in 3D in an aeolian sandstone: The role of cross-bed orientation. Tectonophysics 574–575: 204–218. http://dx.doi.org/10.1016/j.tecto.2012.08.037.
Deng, S., Aydin, A., 2015. The strength anisotropy of localized compaction: A model for the role of the nature and orientation of cross-beds on the orientation and distribution of compaction bands in 3-D. Journal of Geophysical Research, Solid Earth 120: doi:10.1002/2014JB011689.
|