|
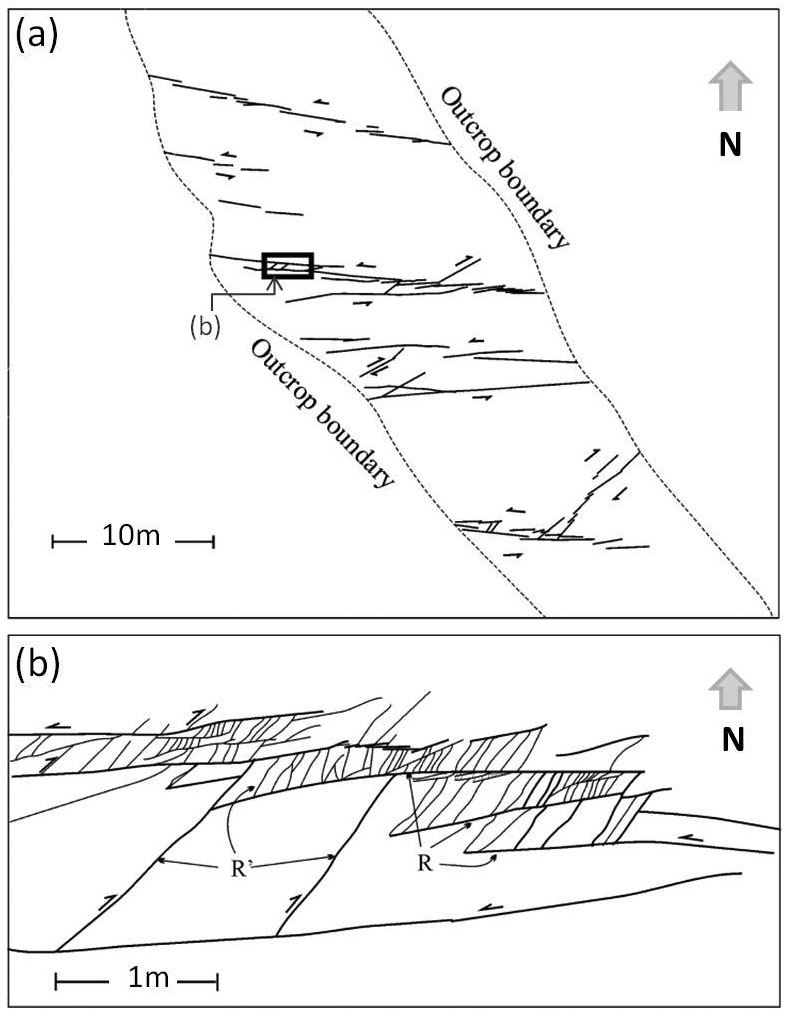
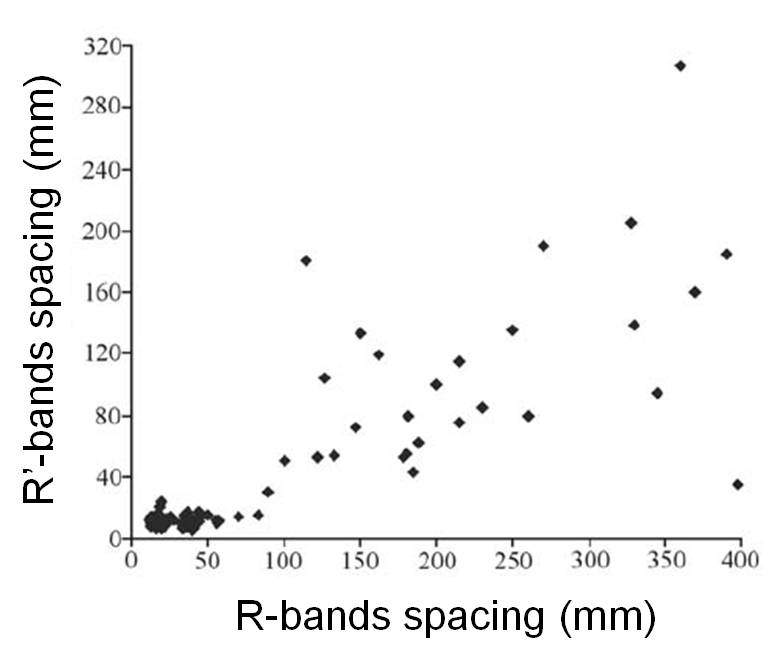
We have documented and analyzed the geometric, statistical and scaling properties of individual and single sets of deformation bands of shear and compaction kinds in corresponding discussions marked by proper links. Presumably, the methods used there and the results obtained are applicable for individual members and sets within multiple sets of deformation bands with the caveat that the earlier sets have a substantial affect on the properties of the sets which formed later. To illustrate this phenomenon, it is sufficient to examine the maps in Figure 1a and b and the spacing plots (Figure 2) of the two sets of shear bands identified as R and R' following the nomenclature used for the so-called Riedel shears. A casual inspection may reveal that the spacing and the length of the two sets are different, which is also evident in the plot in Figure 2. Note that this affect is similar to that of other structure types that we presented under corresponding classes (joints. pressure solution bands, and faults). Nevertheless, the term, hierarchical property that was used for faulting, can also be used to describe the shear band system in the maps in Figure 1a and b. Although the mechanisms affecting the statistical properties such as length and spacing of the sets may be different but the resulting dimensional properties are comparable.
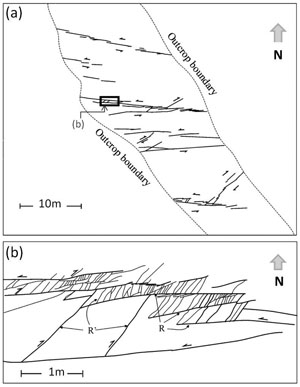 | | Figure 1. Two conjugate sets of shear bands with right- and left-lateral sense of motions in the Navajo Sandstone exposed in the Capitol Reef National Park, Utah. Such patterns with echelon shear structures are attributed to Riedel. The so-called R and R' sets form a hierarchical pattern with the earlier set (R) influencing the distribution and dimensions of the later set (R'). From Katz et al. (2004). |
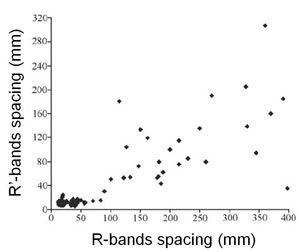 | | Figure 2. R and R' shear band spacing showing that the R' spacing increases with the R spacing though R spacing is generally larger than R' spacing due to the influence of the first generation set on the second one. Simplified from Katz et al. (2004). |
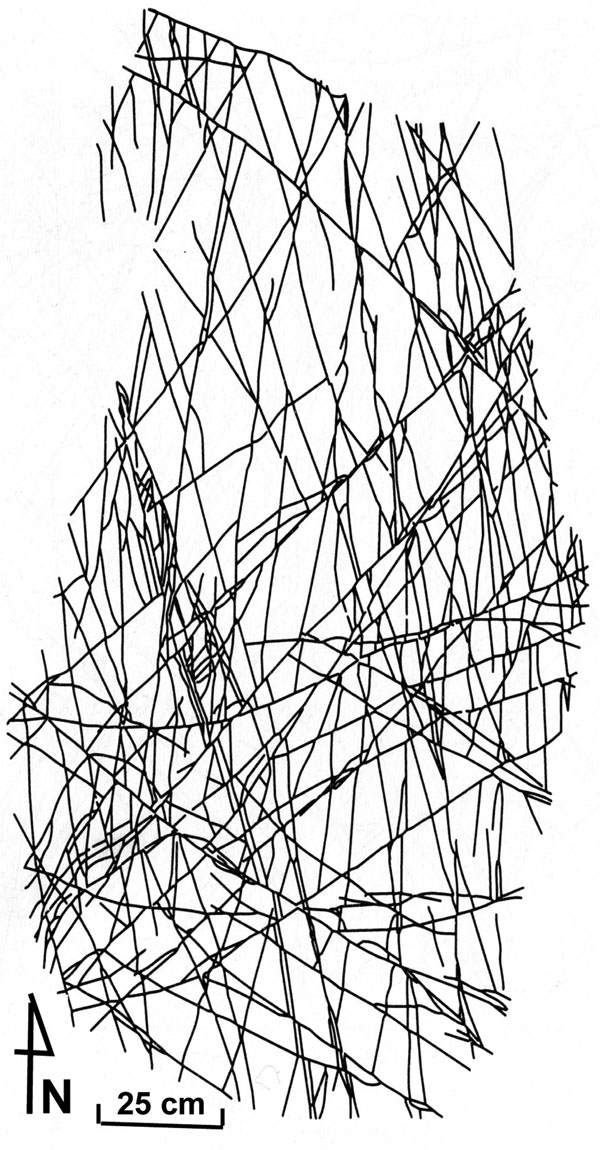
It is more appropriate to use an area-based method for evaluating the statistical properties of structure networks in two dimension rather than line-based methods which are one dimensional. For example, Figure 3 shows a map of a network of shear bands in a sandstone sample of the Morrison Formation (Barton, 1995). A box counting method called box-flex was used to analyze scaling and clustering of the shear bands network shown in Figure 3. The author determined that the data indicates a fractal distribution (Figure 4) with a fractal dimension of 1.50.
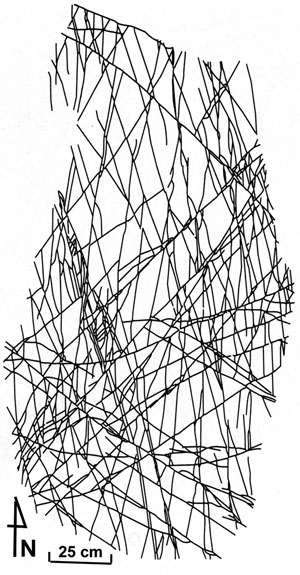 | | Figure 3. Map showing a network of shear bands in multiple sets on a flat surface of a sandstone piece from the Morrison Formation, Colorado. From Barton (1995). |
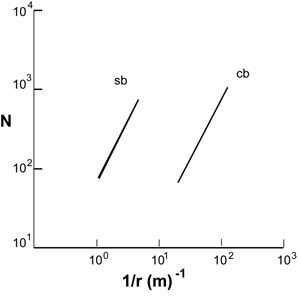 | | Figure 4. Log-log plot for shear bands (sb) in multiple sets in Figure 3, the slope of which defines a fractal number of D, 1.50, where N is for the number of cells and r is the cell size (side length). Simplified and redrawn from Barton (1995). |
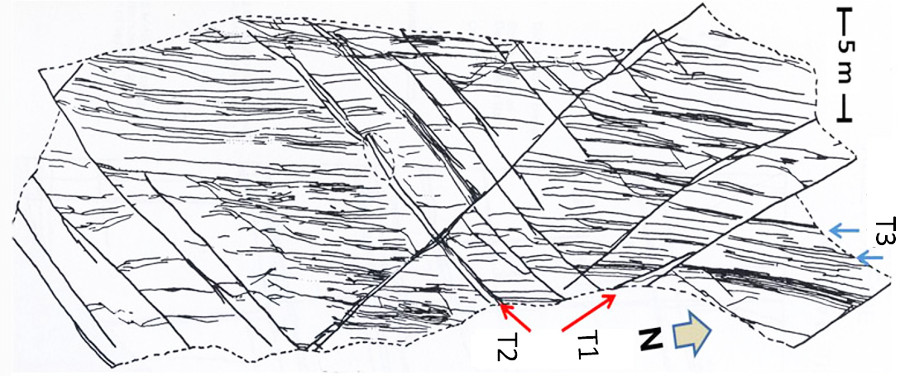
2D and 3D patterns of compaction bands are extremely complicated. Using a trace map (Figure 5), Barton, similar to his analysis of shear bands mentioned above, determined that the compaction bands network has a fractal dimension of 1.58.
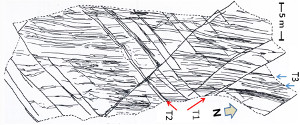 | | Figure 5. Map showing a network of compaction bands comprising two major sets and the third set confined between the two major sets exposed on a pavement of the Aztec Sandstone exposed at the Cottonwood Creek in the Valley of Fire State Park, Nevada. Note that the youngest set with N-S trend has the shortest lengths and narrowest spacing. For fractal plot for this network, see (cb) in Figure 4. From Hill (1989). |
| |
Barton, C.C., 1995. Fractal analysis of scaling and spatial clustering of fractures. in Fractals in the Earth Sciences edt C.C. Barton and P.R. La Pointe, pp 141-178, Plenum Press, New York and London.
Hill, R.E., 1989. Analysis of deformation bands in the Aztec Sandstone, Valley of Fire State Park, Nevada. Master of Science thesis, University of Nevada, Las Vegas, 68p.
Katz, Y., Weinberger, R., Aydin, A., 2004. Geometry and kinematic evolution of Riedel shear structures, Capitol Reef National Park, Utah. Journal of Structural Geology 26: 491–501.
|