| |||||||||
|
|
|||||||||
|
|
|||||||||
| Thickness Distribution of Damage Zone | |||||||||
|
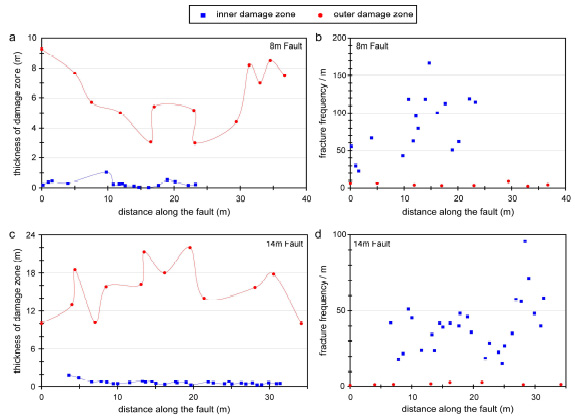
As discussed in the section 'Fault Damage Zones,' de Joussineau and Aydin (2006, 2007) characterized the inner and outer damage zones of strike-slip faults with larger than 5 meter slip in Aztec Sandstone exposed in Valley of Fire State Park, Nevada. Scanlines are measured along three damage zones of increasing apparent maximum slip magnitudes of 8, 14, and 80 meters. Figure 1 shows the variations in thicknesses and fracture frequency in the inner and outer damage zones of the 8 m fault and 14 m fault. The inner damage zone has a thickness on the order of several tens of centimeters, which shows little variation along the faults (blue in Figures 1(a) and 1(c)). The fracture frequency in this inner zone is very high with several tens of fractures per meter and it varies significantly, reflecting the selective localization of fracture infilling within the damage zone (blue rectangles in Figures 1(b) and 1(d)). The thickness of the outer damage zone varies significantly along the faults and is on the order of several meters for the 8 m fault and 10-20 meters for the 14 m fault (red in Figures 5(a) and 5(c)). The fracture frequency in the outer zone is very low, with only a few fractures per meter, showing little variation along the measured section of the faults (red full circles in Figures 1(b) and 1(d)).
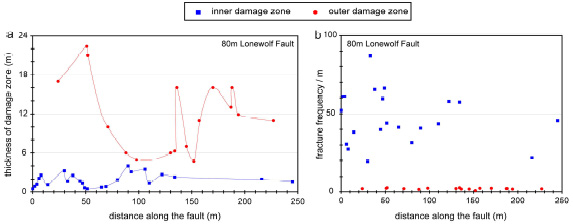
Figure 2 shows the variations in thickness and fracture frequency in the inner and outer damage zones along a section of the 80 m fault. The inner damage zone of the 80 m fault has a thickness on the order of one to several meters, showing greater variation than was seen in the 8 m and 14 m faults (blue in Figure 2(a)). The fracture frequency in this inner zone is very high with several tens of fractures per meter and it fluctuates noticeably, as is also the case in the 8 m and 14 m faults (blue rectangles in Figure 2(b)). The outer damage zone of the 80 m fault also has characteristics similar to those of the outer damage zones of the 8 m and 14 m faults. Its thickness varies significantly along the fault and ranges from several meters to twenty meters in the area studied (red in Figure 2(a)). The fracture frequency in this outer zone is very low (a few fractures per meter) and shows little variation along the measured section of the fault (red full circles in Figure 2(b)).
| |||||||||
| Reference: |
|||||||||
| de Joussineau, G., Aydin, A., 2006 de Joussineau, G., Aydin, A., 2007 |
|||||||||
|
Readme | About Us | Acknowledgement | How to Cite | Terms of Use | Ⓒ Rock Fracture Knowledgebase |
|||||||||