Rock Fracture
KNOWLEDGEBASE
  

North Sea Fault In-fill Modeling

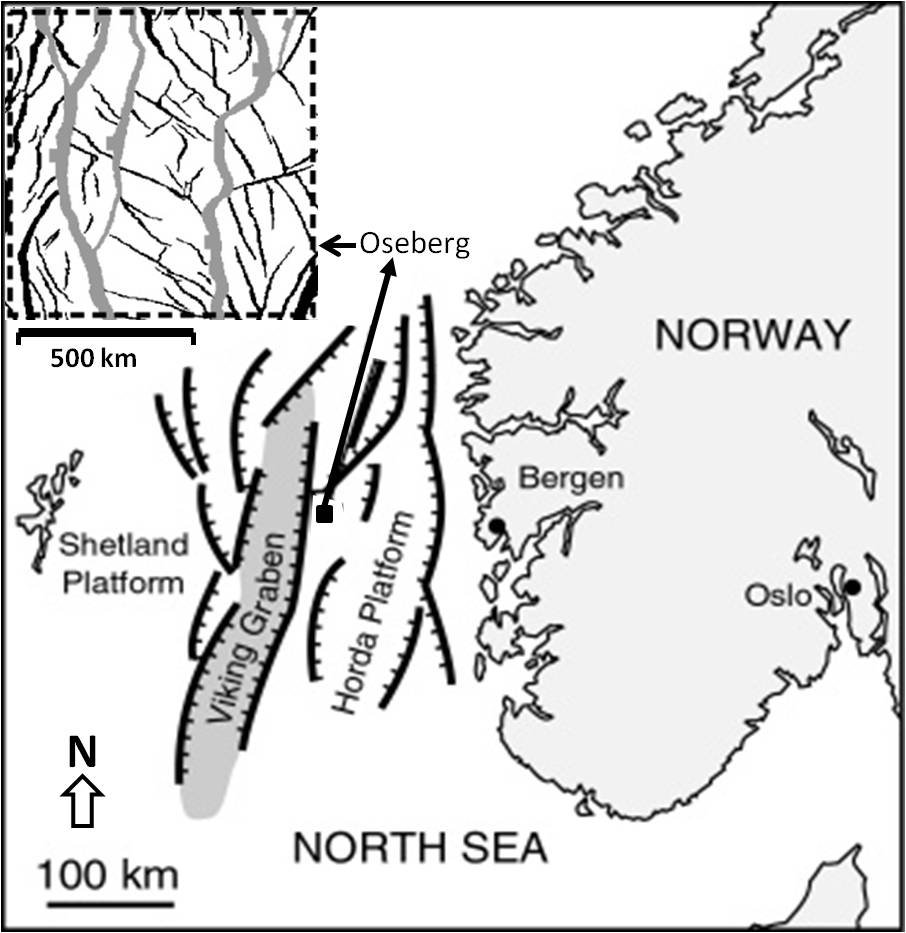
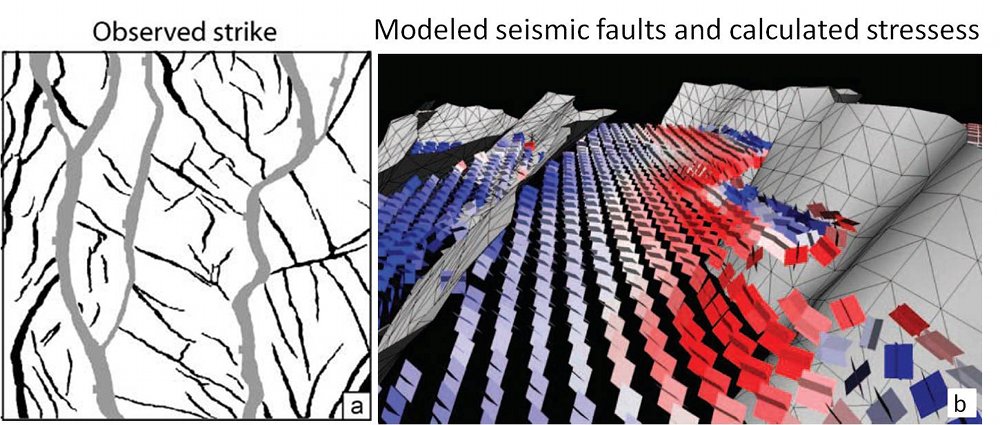
In some cases, certain information about an array of faults is known thanks to seismic surveys and wells. It is then desired to determine the distribution of stresses around the known faults in order to project the density, kinematics, and orientation of other faults of different scale, generally sub-seismic scale, filling the volume in between or beyond the known faults. We summarize a case study here by Maerten et al. (2006) from the Oseberg field in the North Sea, Norway (Figure 1). The authors used a geomechanical model called POLY 3D, the basis of which is an analytical solution for a constant displacement discontinuity or dislocation on a triangular element (see 'Mechanisms and Mechanics of Faults'), though, rectangular elements are also used by other investigators (Dee et al., 2007). The stresses are then calculated at certain observation points as illustrated in Figure 2 for appropriate boundary conditions, for example, an extension applied in the direction of N80 (degrees) E for this case.

Location map of the Oseberg field in the North Sea, off shore Norway. The inset at the upper left corner is a fault map in which faults of larger scale are of gray color. From Maerten et al. (2006).Figure 1. Location map of the Oseberg field in the North Sea, off shore Norway. The inset at the upper left corner is a fault map in which faults of larger scale are of gray color. From Maerten et al. (2006).
Seismically determined larger faults in the Oseberg field with triangular elements and shear stresses at grid points between the faults. Using Coulomb failure criterion, the orientation and densities of smaller faults at the grid points are determined. From Maerten et al. (2006).Figure 2. Seismically determined larger faults in the Oseberg field with triangular elements and shear stresses at grid points between the faults. Using Coulomb failure criterion, the orientation and densities of smaller faults at the grid points are determined. From Maerten et al. (2006).

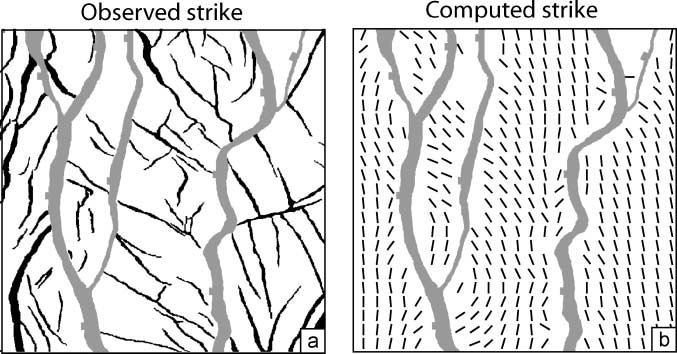
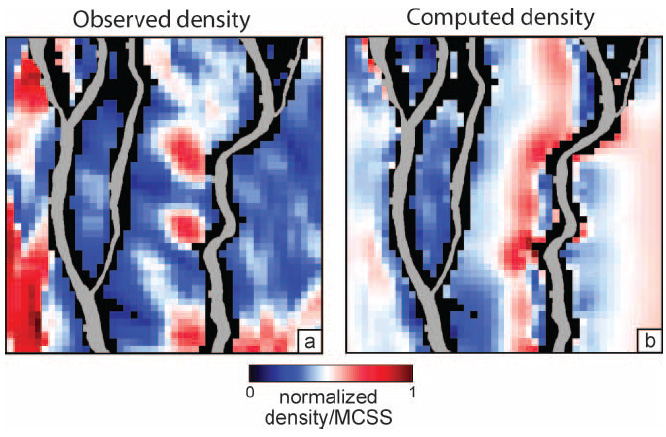
Figures 3 and 4 show some of the results. The two maps in Figure 3 are the observed and predicted fault orientations. Figure 4 shows the observed and calculated fault densities calculated using the major faults (gray) and the method referred to above. Various stochastic methods are also used by the investigators to take the major faults in their final geometry and, alternatively, in the process of incrementally growing and interacting. Interested readers are referred to the original paper for details of these additional models with the caveat that the relative timing of the formation of the smaller faults with respect to the growth of the major faults is not well constrained.

The observed and computed fault strike maps for a remote extension at N80 degrees East direction. (a) Fault map. (b) Computed fault strikes using the major faults (gray) and Coulomb failure criterion. From Maerten et al. (2006).Figure 3. The observed and computed fault strike maps for a remote extension at N80 degrees East direction. (a) Fault map. (b) Computed fault strikes using the major faults (gray) and Coulomb failure criterion. From Maerten et al. (2006).
The observed (at Upper Jurassic horizon) and computed fault density distributions. MCSS bar shows the normalized magnitudes of the Coulomb shear stresses at grid points. The large faults (gray) are used to compute the densities. From Maerten et al. (2006).Figure 4. The observed (at Upper Jurassic horizon) and computed fault density distributions. MCSS bar shows the normalized magnitudes of the Coulomb shear stresses at grid points. The large faults (gray) are used to compute the densities. From Maerten et al. (2006).
Reference:

Bourne, S.J., Willemse, E.J.M, 2001. Elastic stress control on the pattern of tensile fracturing around a small fault network at Nash Point, UK. Journal of Structural Geology 23: 1753-1770.

Dee, S.J., Yielding, G., Freeman, B., Healy, N.J., Kusznir, N., 2007. Elastic dislocation modelling for prediction of small-scale fault and fracture network characteristics. Geological Society, London, Special Publications 270: 139-155.

Maerten, L., Gillespie, P.A., Daniel, J.M., 2006. Three-dimensional geomechanical modeling for constraint of seismic fault simulation. American Association of Petroleum Geologists Bulletin 90: 1337-1358.

Rawnsley, K.D., Auzias, V., Petit, J.P., Rives, T., 1997. Extrapolating fracture orientations from horizontal wells using stress trajectory models. Petroleum Geoscience 3: 145-152.


Readme    |    About Us    |    Acknowledgement    |    How to Cite    |    Terms of Use    |    Ⓒ Rock Fracture Knowledgebase