| |||||||
|
|
|||||||
|
|
|||||||
| Thickness Distribution of Fault Rock | |||||||
|
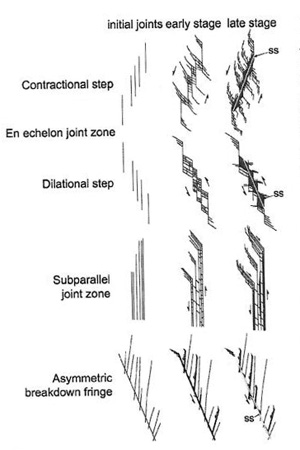
As mentioned under fault zone properties, the geostatistical distribution of fault rock thickness shows large variations. These properties are directly related to the mechanism of faulting, slip magnitude, lithology and fault zone architecture. Let's consider two mechanisms to illustrate this point. Figure 1 includes a series of idealized joint zone geometries and potential fault rock distributions for faults developed from shearing of these initial joint zones in sandstone following Flodin and Aydin (2004).
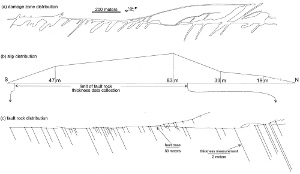
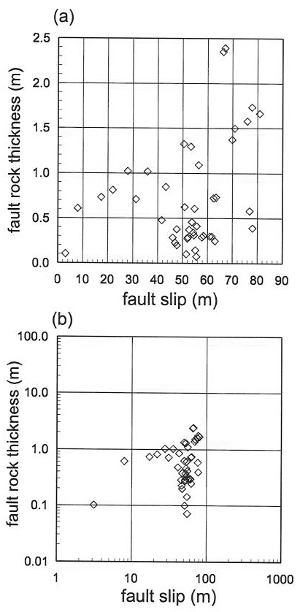
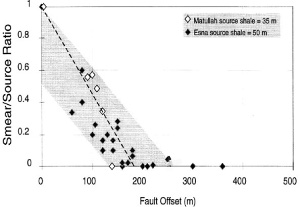
Figure 2 includes actual field data along a relatively large fault zone with 83 meters maximum slip formed by this mechanism in Aztec Sandstone cropping out over Valley of Fire State Park, Nevada. The maps and the measurements illustrate the fault geometry (a) and the distributions of fault rock along the fault zone architecture for a certain portion of the zone (b, c). The diagonal lines in (c) show the local thickness of fault rock with a scale bar of 20 m on the right hand side of the figure. The plots in Figure 3 show linear (a) and log-log (b) plots of fault rock thickness from different faults with increasing slip magnitudes formed by the sheared-joint mechanism in the same rock type. The data suggest that the fault rock thickness shows a large variation for faults even formed by the same mechanism in a relatively homogeneous parent rock (Flodin, 2000). Furthermore, the fault rock along a given fault zone is highly heterogeneous (Flodin et al., 2005). Faults formed by shale smearing is another distinctive faulting mechanism which was covered in more detail somewhere else in this Knowledgebase. Here we note that the shale fault rock thickness in this type of faulting mechanism has a decreasing trend as slip increases (Figure 4) and eventually the shale smearing diminishes at some slip value (Younes and Aydin, 1997; 1998). Shale smear thickness is reported to depend on the original thickness of the shale beds, the magnitude of the slip, the ductility contrast between the shale and nonshale lithologies, and the rate of deformation. In the presence of multiple shale units, the percentage of the sum of all shale bed thicknesses is divided by the fault throw. Shale Gouge Ratio (SGR) is commonly used to measure shale fault rock thickness, which is defined as the percentage of shale or clay in the slip interval and is calculated at a point on a fault surface (Yielding et al, 1997; Yielding, 2002). Shear band faults have cores in which parent sandstones have been deformed cataclastically. This topic has been described under 'Shear Bands.' | |||||||
| Reference: |
|||||||
| Flodin, E.A., 2000 Flodin, E.A., Aydin, A., 2004 Flodin, E.A., Gerdes, M., Aydin, A., Wiggins, W.D., 2005 Yielding, G., Freeman, B., Needham, T., 1997 Yielding, G., 2002 Younes, A.I., Aydin, A., 1997 Younes, A.I., Aydin, A., 1998 |
|||||||
|
Readme | About Us | Acknowledgement | How to Cite | Terms of Use | Ⓒ Rock Fracture Knowledgebase |
|||||||


