| |||||||||
|
|
|||||||||
|
|
|||||||||
| Fault Spacing Distribution | |||||||||
|
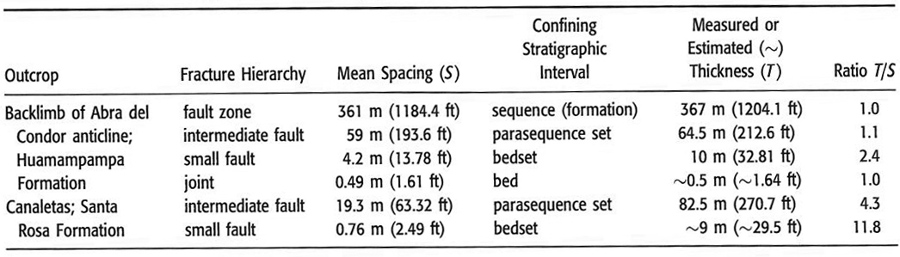
Several studies documented fault spacing from various places. Here we summarize two of them that we are familiar with, which focus on the hierarchy of fault spacing scaling controlled by the faulted rock sequence. Florez-Nino et al. (2005) studied joint and fault distribution in detrital rocks exposed in the Abra del Condor Anticline about 30 km east of the town of Tarija in the Bolivian Andes. They concluded that faults occur at different scales and hierarchies and the dominant fault and fracture style depends on the scale of observation and lithology. In the case of the fault sets perpendicular to the structural grain, the table in Figure 1 shows their spacing and the thicknesses of the stratigraphic sequences in which they occur.
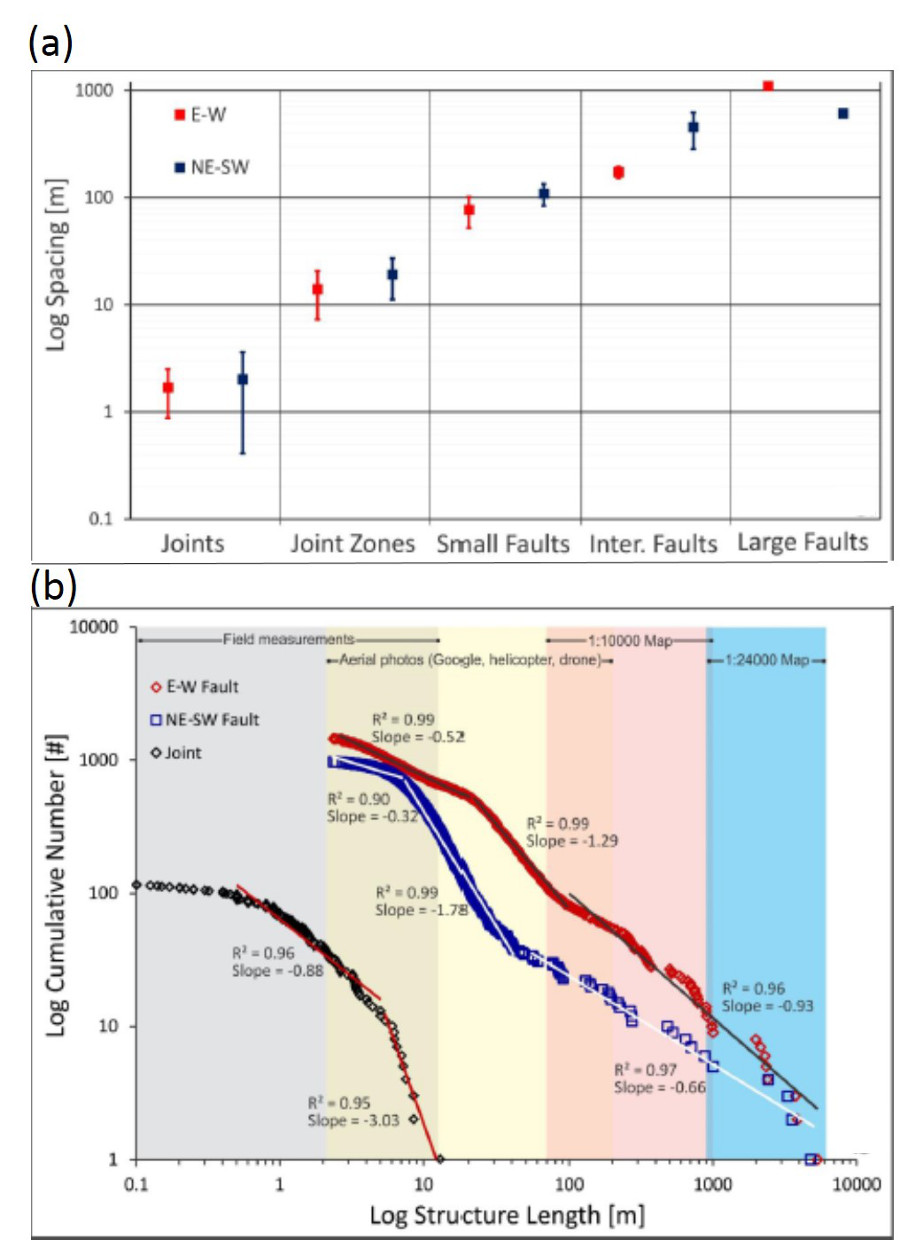
The deformation mechanism within the sandstone units is that of hierarchical shearing of joints, generation and growth of splay joints, and shearing of the splay joints. This process repeats itself several times, giving rise to multiple generations of joints, sheared joints (also see 'Joint Zone Spacing'), and outcrop-scale faults, which can be ranked as 'Fault Zones' (relatively large faults), Intermediate Faults, and Small Faults with the spacing values listed in the far right column. Sheared joints, small faults, and intermediate faults show a log-normal distribution, while the scarce data for fault zones or large faults indicate a normal distribution. The means of these distributions have a first-order relationship with the thickness of the confining stratigraphic sequence given in the column representing the thickness to spacing ratio (T/S). The proportionality factor between spacing and thickness is given by S/T=a, and is interpreted in terms of the variation in extensional and shear strain accommodated by the fault types. The authors concluded that stratigraphic architecture, hence sequence stratigraphy, and shear strain are two of the most important factors controlling the density and localization of the faults. A recent study by Cilona et al. (2016) in the Santa Susana Field Laboratory, a contaminated site in Simi Valley, northeast of the greater Los Angeles area arrived at similar conclusions. Figure 2 shows their results for the two primary sets in the area. The distributions of the categories in terms of their length and the nature of the database are plotted in (b), while the log spacing of the major fracture categories are given in (a). The spacing data for the joint and fault categories show a linear trend and generally about an order of magnitude jump from one category to the next.
| |||||||||
| Reference: |
|||||||||
| Cilona, A., Aydin, A., Likerman, J., Parker, B., Cherry, J., 2016 Florez-Nino, J.M., Aydin, A., Mavko, G., Antonellini, M., Ayaviri, A., 2005 |
|||||||||
|
Readme | About Us | Acknowledgement | How to Cite | Terms of Use | Ⓒ Rock Fracture Knowledgebase |
|||||||||