Rock Fracture
KNOWLEDGEBASE
  

Growth of Faults based on Shale Smearing

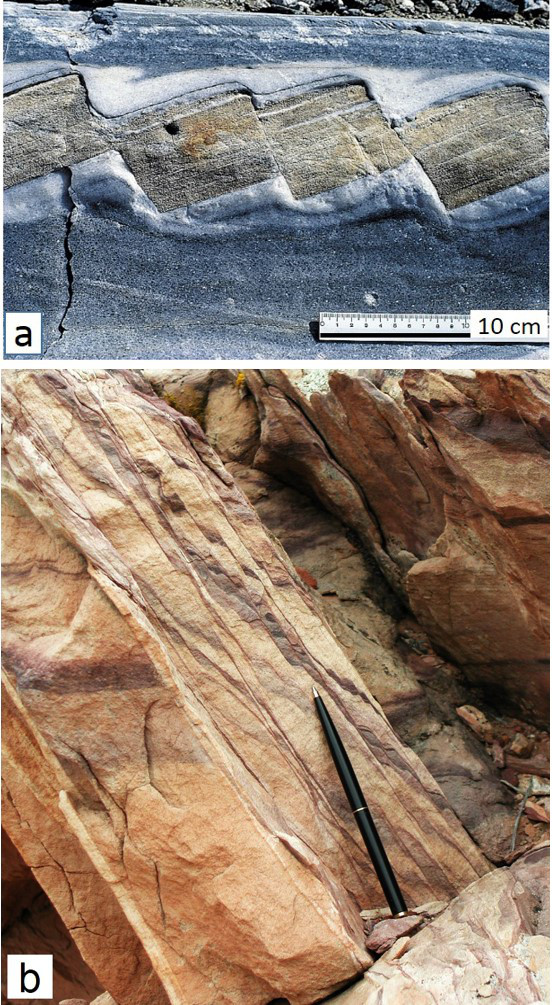
Fault growth in multi-layered rocks made up of stiff (competent-brittle) and soft (incompetent-ductile) lithologies subjected to extension and normal faulting produces a completely different deformation geometry and style which has long been well-known as shale or clay smear in structural geology. The basis of this style of deformation can be seen in a photograph in Figure 1(a) in which a detrital unit embedded between anhydrite layers is deformed by different modes. The extension of the brittle detrital rock by normal faulting and the stretching of the anhydrite layers on both sides by plastic flow result in what is called a boudinage structure. If the ductile or viscous units are mudstone or shale embedded within brittle sequences such as sandstones or limestones, then the shale layers deform by smear faults as shown in Figure 1(b).

Extensional deformation of alternating ductile and brittle rocks. (a) Detrital rock unit has been deformed by normal faulting in the middle and the surrounding anhydrite layers have been deformed by stretching and flow. From a brochure by ETH. (b) Flow of mud layers (purple color) along normal faults in the Entrada sandstone exposed on the southwestern limb of the Salt Valley anticline, Arches National Park, Utah.Figure 1. Extensional deformation of alternating ductile and brittle rocks. (a) Detrital rock unit has been deformed by normal faulting in the middle and the surrounding anhydrite layers have been deformed by stretching and flow. From a brochure by ETH. (b) Flow of mud layers (purple color) along normal faults in the Entrada sandstone exposed on the southwestern limb of the Salt Valley anticline, Arches National Park, Utah.

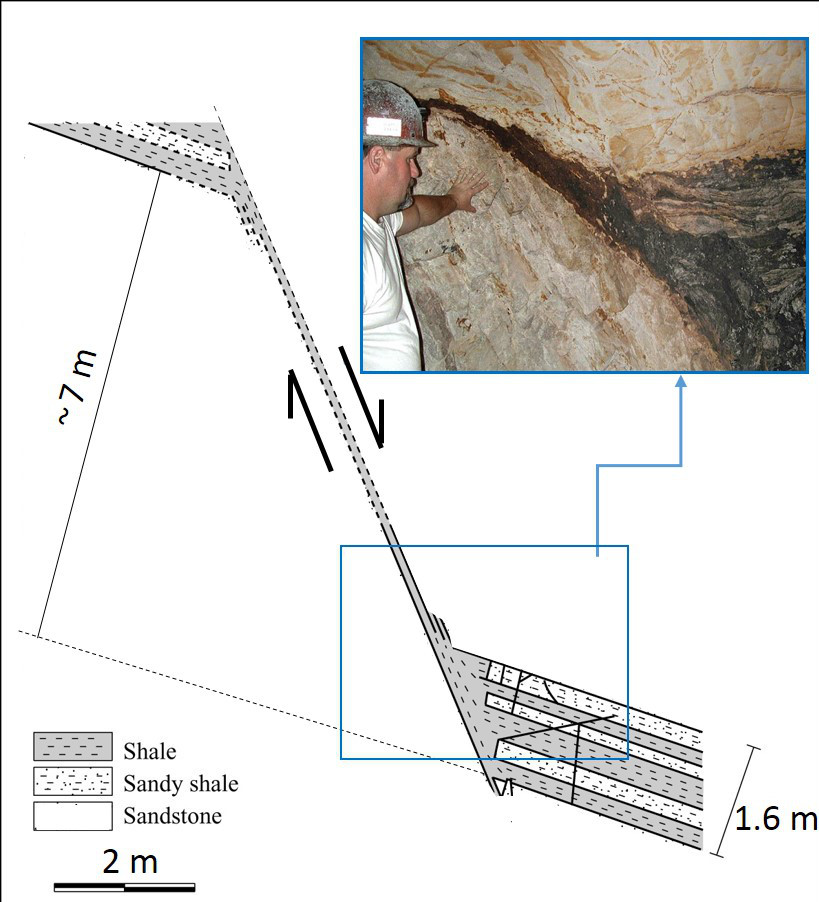
This is generally referred to as shale or clay smear in structural geology and petroleum geology. One of the best examples of this phenomenon from an underground mine in California has been described and analyzed by Eichhubl et al. (2005), where a shale unit of 1.6 m thick has been entrained and attenuated forming a thin smear of locally less than a few centimeters thick along a normal fault of about 7 to 8 m offset (see map in Figure 2 and the inset photograph).

A cross section and a photograph showing a shale unit, normally about 1.6 m thick. Shale dominated units embedded within a thick sandstone unit were entrained along a normal fault (>1.7 m offset) in the Black Diamond Mine, California. Multiple layers of shale and sandy shale are reduced to a narrow smear of locally a few centimeters at certain parts of the fault. From Eichhubl et al. (2005).Figure 2. A cross section and a photograph showing a shale unit, normally about 1.6 m thick. Shale dominated units embedded within a thick sandstone unit were entrained along a normal fault (>1.7 m offset) in the Black Diamond Mine, California. Multiple layers of shale and sandy shale are reduced to a narrow smear of locally a few centimeters at certain parts of the fault. From Eichhubl et al. (2005).

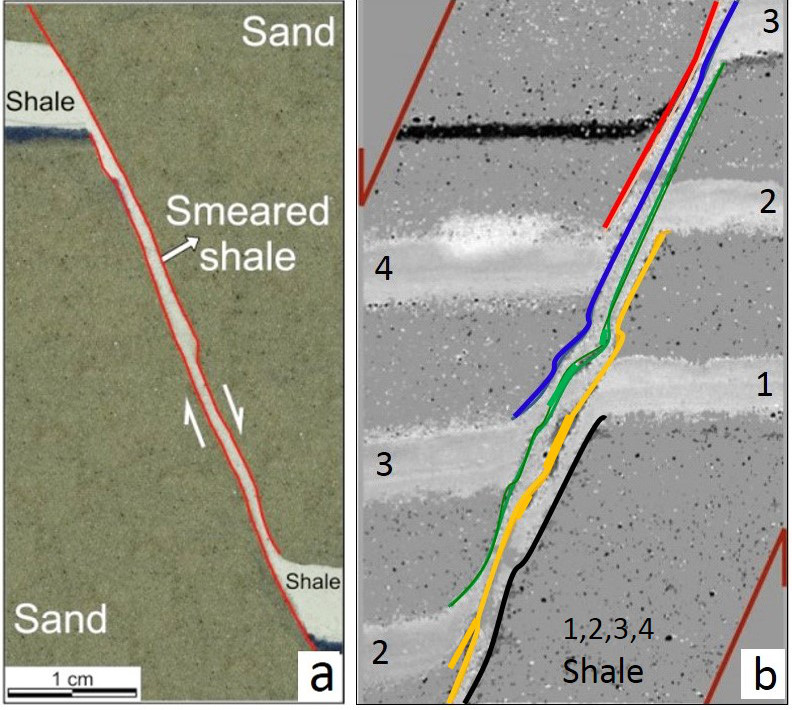
Similar deformation styles have been produced in experiments using various materials, commonly sand and clay as stiff and soft layers, respectively. Figure 3(a) illustrates a single layer which deformed along a normal fault instigated by a moving basement (Noorsaley-Garakani et al., 2013). Figure 3(b) is another example from an analog experiment using multi clay layers (Schmatz et al. 2010; in http://www.ged.rwth) with large enough applied offset resulting in the merging and coalescing of closely spaced clay layers.

Deformation of a single shale layer (a), and multi-layers of shale (b), both embedded within sand in laboratory experiments. (a) From Noorsaley-Garakani et. (2013); (b) From Schmatz et al. (2010). The present illustration is from http://www.ged.rwth with the faults highlighted by A. Aydin. Also see, Vrolijk et al. (2016) for additional information.Figure 3. Deformation of a single shale layer (a), and multi-layers of shale (b), both embedded within sand in laboratory experiments. (a) From Noorsaley-Garakani et. (2013); (b) From Schmatz et al. (2010). The present illustration is from http://www.ged.rwth with the faults highlighted by A. Aydin. Also see, Vrolijk et al. (2016) for additional information.

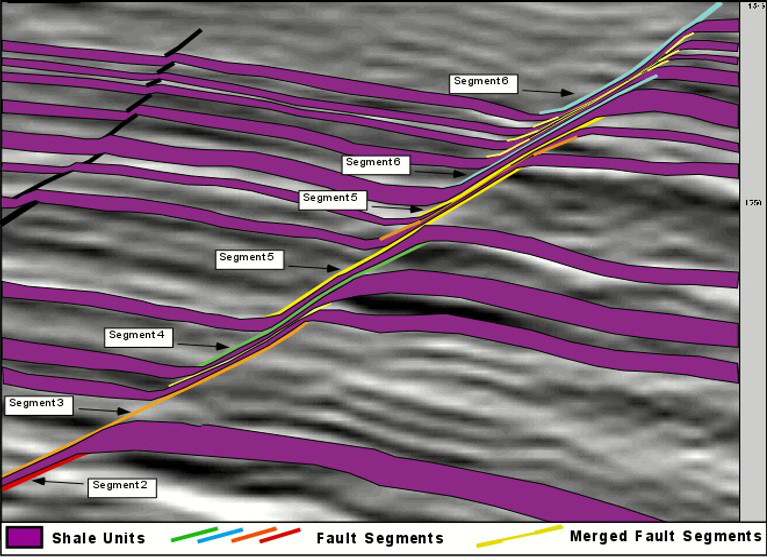
Figure 4 is a visualization of a more complex configuration interpreted from a subsurface seismic data set involving multi shale units embedded within sand deposits (Koledoye et al., 2000, 2003). The normal fault array on the left-hand side has limited offset and the shale layers and the fault segments are distinctly separate. The array on the right part of the section has tens of meters offset and the smeared shale rocks and the bounding faults merged or coalesced. Some shale units along the normal fault array may have disappeared completely.

A seismic section showing interpreted normal faults with shale smear in alternating shale and sand at the Niger Delta. The fault zone with distinct fault segments on the left side is an incipient fault array with small normal offsets, but the zone on the right-hand side is a relatively large composite fault zone of several merged or coalesced smeared shales and bounding normal faults. From Koledoye et al. (2003).Figure 4. A seismic section showing interpreted normal faults with shale smear in alternating shale and sand at the Niger Delta. The fault zone with distinct fault segments on the left side is an incipient fault array with small normal offsets, but the zone on the right-hand side is a relatively large composite fault zone of several merged or coalesced smeared shales and bounding normal faults. From Koledoye et al. (2003).

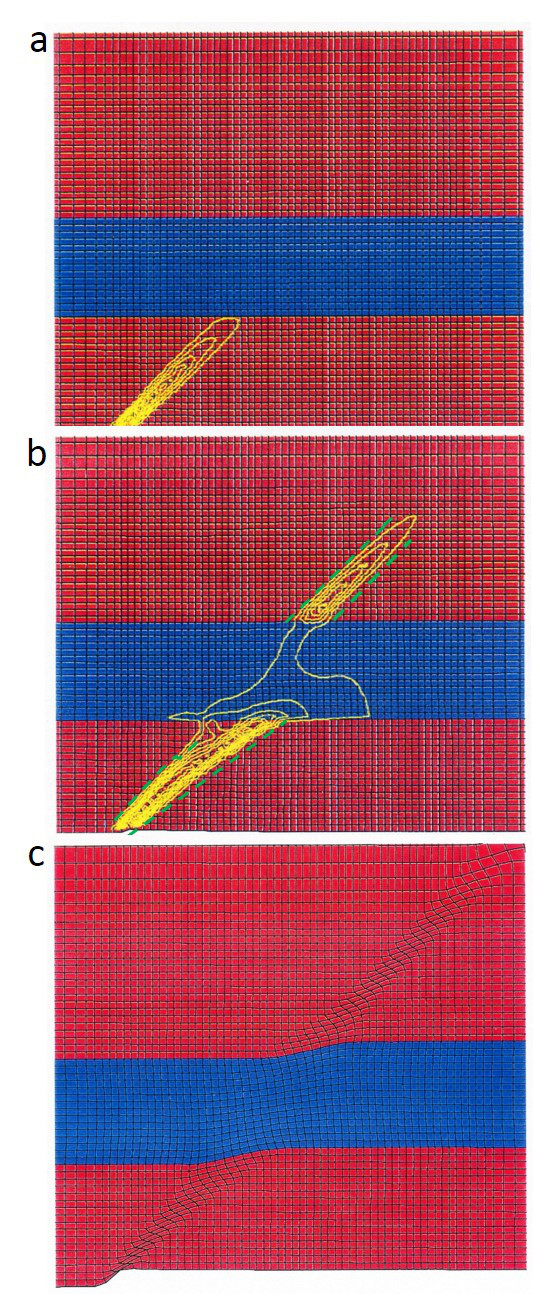
There are two critical elements in the process of smear faults: The first one is the ductility or viscosity of shale, which is a prerequisite because otherwise it would behave like any other multi-layer brittle rock. The second one is the sense of off-plane jump of the brittle failure structures across the ductile layer, which experiences dilatant plastic strain analogous to necking in metal plasticity. These concepts are supported by a series of FEM numerical experiments with a viscous layer embedded in an elastic-plastic medium subjected to lateral extension (Dawson and Aydin, 1999). The failure occurs in the form of strain softening across a few grids at the bottom side of the viscous layer, probably due to a boundary effect (Figure 5(a)). This localized discontinuity of the strain rate is called 'smear crack' in mechanics. The jump of the localized shear strain to the top layer occurs out of plane in such a way that the extensional plastic or viscoplastic deformation of the softer middle layer is accommodated as the shear strain on the segments increases. Dashed green lines bounding the smeared cracks in the figure illustrate the lateral shift of the localized zones as the lower smeared structure jumps over from bottom layer to top layer. The line markers were removed in Figure 5(c) to show the segments. The stepover structure is an extensional shear band for the lack of any better term. A similar jumping across soft layers occurs when an opening mode fracture or joint tends to cross a shale layer (Helgeson and Aydin, 1991). Although rare, the failure structures on either side of a shale layer may form a contraction step, an example of which is provided in the echelon faults section. In this case, the segments are independent of each other and the shale in the middle may be squeezed out into the top or bottom layers by extrusion.

Smear crack numerical models using FLAC with a viscous layer within elastic-plastic medium subjected to horizontal stretch with constant velocities simulating initiation of faults with shale smearing. (a) Contours of shear strain rate in the bottom layer below the viscous layer; (b) Off-plane jump of the localized zone of higher shear strain rate in the top layer; and (c) offset of the viscous layer by a distributed shear. Dashed green lines in (b) are to emphasize the boundaries of the concentrated shear strain zone on either side of the viscous layer with a step-like arrangement. From Dawson and Aydin (1999).Figure 5. Smear crack numerical models using FLAC with a viscous layer within elastic-plastic medium subjected to horizontal stretch with constant velocities simulating initiation of faults with shale smearing. (a) Contours of shear strain rate in the bottom layer below the viscous layer; (b) Off-plane jump of the localized zone of higher shear strain rate in the top layer; and (c) offset of the viscous layer by a distributed shear. Dashed green lines in (b) are to emphasize the boundaries of the concentrated shear strain zone on either side of the viscous layer with a step-like arrangement. From Dawson and Aydin (1999).

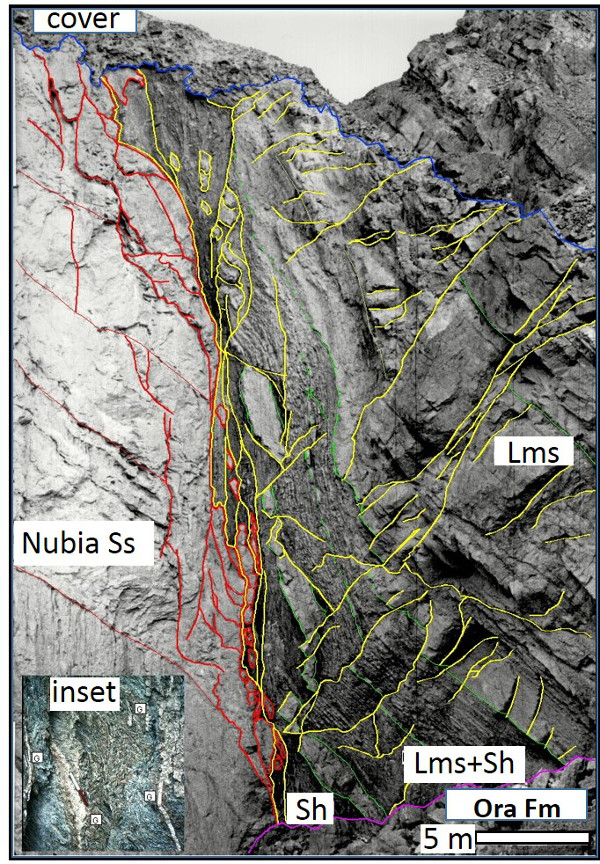
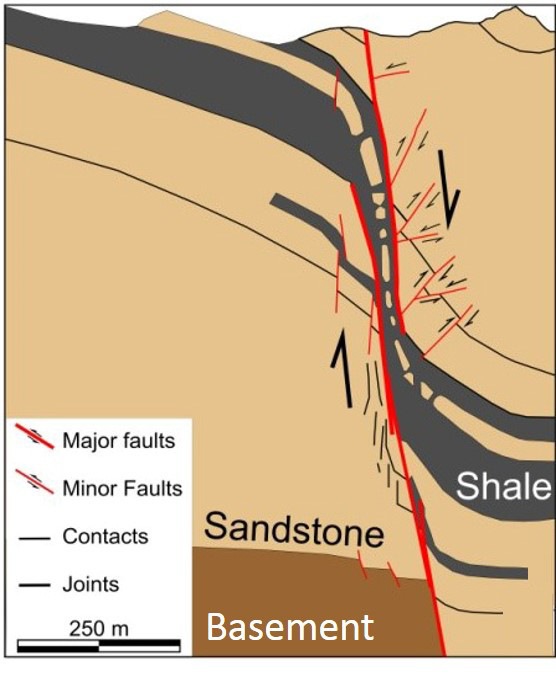
It of course follows that variable distribution of soft and stiff units produces highly complex depositional and structural configurations in nature. Figure 6(a) is an example for such a complex normal fault with about 250 meters offset (Aydin and Eyal, 2002). There, a member of the formation (Ora Formation) is a shale unit of about 60 meters thick that is undeformed at the right side of the picture, but has been attenuated along the high-angle normal fault to the brink of becoming discontinuous. Also notice the strings of brittle layers embedded within the lower part of the shale unit as boudins as well as many oblique faults accommodating deformation adjacent to the major fault on their hanging wall as conceptualized in Figure 7.

A relatively large size normal fault (250 m throw) with shale fault rock derived from the lower Ora Formation. Normally 60 m thick, exposed about 10 km west-northwest of the town of Elat in the Gulf of Elat/Aqaba. Note the disontinuous and complex deformation of the adjacent sandstone and limestone layers of the surrounding rocks. Inset show a detailed photograph of a highly deformed fault rock. From Aydin and Eyal (2002).Figure 6. A relatively large size normal fault (250 m throw) with shale fault rock derived from the lower Ora Formation. Normally 60 m thick, exposed about 10 km west-northwest of the town of Elat in the Gulf of Elat/Aqaba. Note the disontinuous and complex deformation of the adjacent sandstone and limestone layers of the surrounding rocks. Inset show a detailed photograph of a highly deformed fault rock. From Aydin and Eyal (2002).
A schematic cross-sectional diagram showing the aspects of the deformation associated with the fault in Figure 6. Thinner stiff layers (commonly limestone) in the hanging wall are offset by a series of normal and reverse faults. From Aydin and Eyal (2002).Figure 7. A schematic cross-sectional diagram showing the aspects of the deformation associated with the fault in Figure 6. Thinner stiff layers (commonly limestone) in the hanging wall are offset by a series of normal and reverse faults. From Aydin and Eyal (2002).

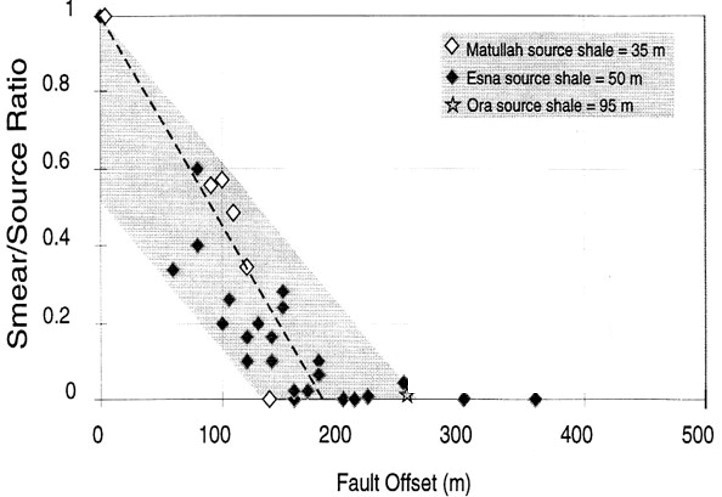
In subsurface applications of the shale deformation concepts to petroleum geology (Yielding et al., 1997; Vrolijk et al, 2016) and hydrogeology (Bense et al., 2013; Ciftci et al., 2013; Cilona et al., 2014), it is desirable to estimate the reduction of the smear thickness, particularly at its vanishing point. Figure 8 is a plot of smear thickness normalized by the undeformed thickness of three shale units versus throw for several predominantly normal faults in the eastern Gulf of Suez, Egypt. Where data is available, the smear thickness decreases as the amount of offset increases for the same fault and the decreasing smear shale or fault rock thicknesses correspond to progressively larger offsets of the shale units surveyed (Data from Younes and Aydin, 1998; Aydin and Eyal, 2002). In the presence of multiple shale units in close proximity to each other within the same formation, merging of smeared shale units may occur as pointed out above.

Plot showing the ratio of smeared shale thickness normalized by the original shale unit thickness for three cases as a function of increasing offset. All three units with thicknesses of 35, 50, and 95 m are exposed in the eastern Gulf of Suez and Sinai. From Younes and Aydin (1998).Figure 8. Plot showing the ratio of smeared shale thickness normalized by the original shale unit thickness for three cases as a function of increasing offset. All three units with thicknesses of 35, 50, and 95 m are exposed in the eastern Gulf of Suez and Sinai. From Younes and Aydin (1998).
Reference:

Aydin, A., Eyal, Y., 2002. Anatomy of a normal fault with shale smear: Implications for fault seal. American Association of Petroleum Geologists Bulletin 86 (8): 1367-1381.

Bense, V.F., Gleeson, T., Loveless, S.E., Bour, O., Sciebek, J., 2013. Fault zone hydrogeology. Earth-Science Reviews 127: 171-192.

Ciftci, N.B., Giger, S.B., Clennell, M.B., 2013. Three-Dimensional structure of experimentally produced clay smears: Implications for fault seal analysis. American Association of Petroleum Geologists Bulletin 97: 733–757, DOI:10.1306/10161211192.

Cilona, A., Aydin, A., Johnson, N.M., 2014. Permeability of a fault zone crosscutting a sequence of sandstones and shales and its influence on hydraulic head distribution in the Chatsworth Formation, California, USA. Hydrogeology Journal, DOI 10.1007/s10040-014-1206-1.

Cilona, A., Aydin, A., Likerman, J., Parker, B., Cherry, J., 2016. Structural and statistical characterization of joints and multi-scale faults in an alternating sandstone and shale turbidite sequence at the Santa Susana Field Laboratory: Implications for their effects on groundwater flow and contaminant transport. Journal of Structural Geology 85: 95-114, http://dx.doi.org/10.1016/j.jsg.2016.02.003.

Dawson, E.A., Aydin, A., 1999. Smeared crack modeling of brittle/viscous layers. Stanford Digital Repository. Available at: http://purl.stanford.edu/kv027dg6697.

Eichhubl, P., D'Onfro, P.S., Aydin, A., Waters, J., McCarty, D.K., 2005. Structure, petrophysics, and diagenesis of shale entrained along a normal fault at Black Diamond Mines, California-Implications for fault seal. American Association of Petroleum Geologists Bulletin 89 (9): 1113-1137.

Koledoye, B., Aydin, A., May, E., 2000. 3-D Visualization of Fault Segmentation and Shale Smearing in the Niger Delta. The Leading Edge 19: 692-701.

Koledoye, B., Aydin, A., May, E., 2003. A new process-based methodology for analysis of shale smear along normal faults in the Niger Delta. American Association of Petroleum Geologists Bulletin 87 (3): 445 - 463.

Noorsalehi-Garakania, S., Kleine Vennekate, G.J., Vrolijk, P., Urai, J.L., 2013. Clay-smear continuity and normal fault zone geometry – First results from excavated sandbox models. Journal of Structural Geology 57: 58–80.

Schmatz, J., Vrolijk, P., Urai, J.L., 2010. Clay smear in normal fault zones - the effect of multilayers and clay cementation in water-saturated model experiments. Journal of Structural Geology 32: 1834-1849.

Vrolijk, P., Urai, J.L., Kettermann, M., 2016. Clay smear: Review of mechanisms and applications. Journal of Structural Geology 86: 95-152.

Yielding, G., Freeman, B., Needham, T., 1997. Quantitative fault seal prediction. American Association of Petroleum Geologists Bulletin 81, 897– 917.

Younes, A.I., Aydin, A., 1998. Gulf of Suez Field Trip Guidebook. The Stanford Shale Smear Project 1998 Field Trip Guide. Stanford Digital Repository. Available at: http://purl.stanford.edu/jp025yc8745.


Readme    |    About Us    |    Acknowledgement    |    How to Cite    |    Terms of Use    |    Ⓒ Rock Fracture Knowledgebase