Rock Fracture
KNOWLEDGEBASE
  

Interaction of Faults

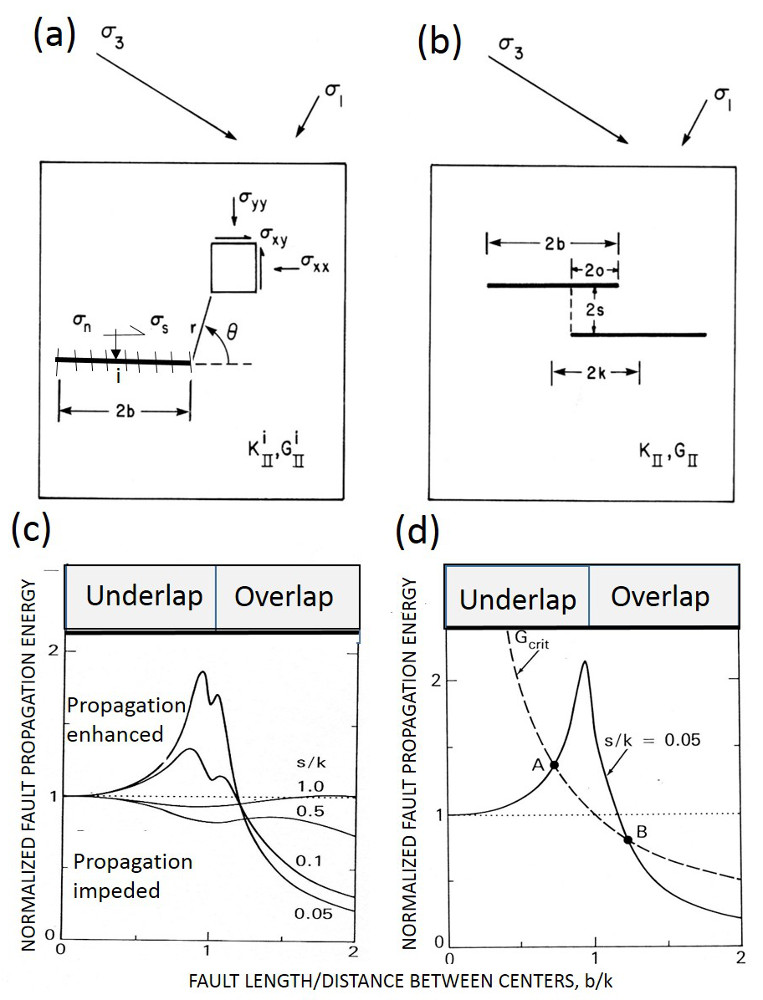
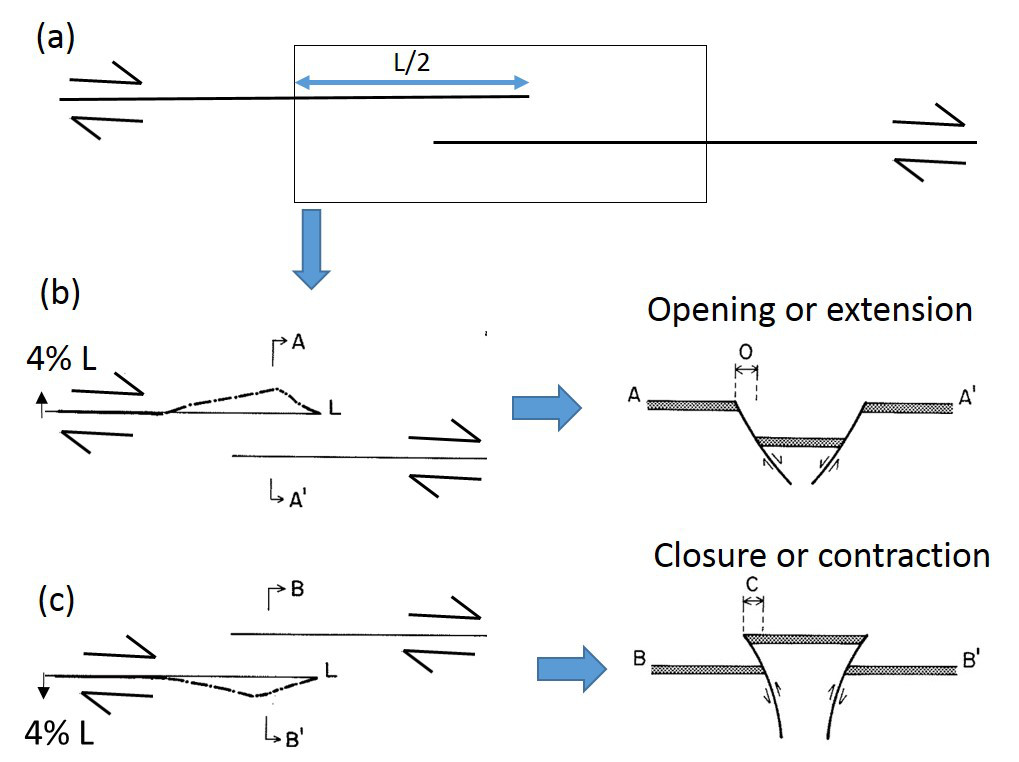
Faults are associated with perturbed stresses which vary spatially. This variation is the largest around the periphery (tips in 2D) of faults and drops down to the background values away from the fault at a distance which is proportional to the fault length. Examples of stress distributions around idealized single faults are given under the link, 'Fracture Mechanics.' Presence of other faults or fractures within the regions of the perturbed stresses facilitates interaction between them and the master fault. The nature of this interaction depends on the spatial distribution of these structures with respect to each other, their orientation, and the remote loading.

Field evidence of fault interactions has been well documented. Among these are the dimensional properties of the echelon geometry of faults and how they are controlled by fault interaction. It is intriguing that fault overlaps are proportional to the fault separation (Aydin and Schultz, 1990). This has been analyzed using a displacement discontinuity model (Figure 1) originally developed by Crouch (1976) and Crouch and Starfield (1983). Figure 1 shows a summary of the results from this analysis: The interaction is important if the faults are closely spaced and their tips are closer as shown in Figure 1(c) for frictionless faults and Figure 1(d) for a pair of echelon faults with moderate friction coefficient of 0.6. The interaction also influences the dilation or contraction of fault zones as illustrated in Figure 2 (Aydin et al. 1990). For example, fault interaction produces opening along the overlapping parts of the fault within dilational steps (Figures 2a, b, and c) and contraction within the contractional steps (Figures 2c and d). The dilation and contraction within the fault zones may manifest themselves in different ways depending on the rock rheology. It is possible that the dilation may be localized along the fault zone as simple opening or by a distributed shearing.

(a) Normal (σ<sub>n</sub>) and shear (σ<sub>s</sub>) tractions and corresponding displacement discontinuities (Dn, Ds) on boundary elements along a single fault of length 2b. Stress components in Cartesian coordinates at a point defined by an angle (θ) and distance (r) from the fault tip are also marked. KII and GII denote Stress Intensity Factor and Fault Propagation Energy, respectively. (b) Geometric parameters for two echelon faults (2b fault length; 2k center distance, 2o overlap, 2s separation). (c) Fault Propagation Energy for frictionless faults in an extensional step normalized by that of an isolated fault. Fault interaction is stronger for relatively closer faults. The Fault Propagation Energy increases sharply as the inner tips approach each other and decreases after the inner tips pass each other. (d) Fault Propagation Energy normalized by that of an isolated single fault and a hypothetical case marked as Gcrit defining the intersection points (A) and (B) corresponding to the start and cease, respectively, of the propagation of the inner fault tips. From Aydin and Schultz (1990).Figure 1. (a) Normal (σn) and shear (σs) tractions and corresponding displacement discontinuities (Dn, Ds) on boundary elements along a single fault of length 2b. Stress components in Cartesian coordinates at a point defined by an angle (θ) and distance (r) from the fault tip are also marked. KII and GII denote Stress Intensity Factor and Fault Propagation Energy, respectively. (b) Geometric parameters for two echelon faults (2b fault length; 2k center distance, 2o overlap, 2s separation). (c) Fault Propagation Energy for frictionless faults in an extensional step normalized by that of an isolated fault. Fault interaction is stronger for relatively closer faults. The Fault Propagation Energy increases sharply as the inner tips approach each other and decreases after the inner tips pass each other. (d) Fault Propagation Energy normalized by that of an isolated single fault and a hypothetical case marked as Gcrit defining the intersection points (A) and (B) corresponding to the start and cease, respectively, of the propagation of the inner fault tips. From Aydin and Schultz (1990).
Fault normal dilation and contraction within the overlapping portion of echelon strike-slip faults. (a) Model configuration. Rectangle shows the area considered in the following figures. (b) Fault normal dilation across the overlapping faults with extensional step. Two modes of extension (simple dilation and extension faulting) are depicted. (c) Fault normal contraction with two modes (localized contraction and thrust faulting) illustrated. Modified from Aydin et al. (1990).Figure 2. Fault normal dilation and contraction within the overlapping portion of echelon strike-slip faults. (a) Model configuration. Rectangle shows the area considered in the following figures. (b) Fault normal dilation across the overlapping faults with extensional step. Two modes of extension (simple dilation and extension faulting) are depicted. (c) Fault normal contraction with two modes (localized contraction and thrust faulting) illustrated. Modified from Aydin et al. (1990).

The occurrence of pull-apart and pushup structures are well known, particularly in strike-slip fault environments (Aydin and Nur, 1982). This has been attributed to the concentration of extension for pull-aparts and contraction for pushups (Figures 3a, b) due to increasing tensile stresses and lower mean stresses at pull-aparts, and compressive stresses and increasing compressive mean stresses at push-ups. Although distribution of tensile and contraction stresses at the corresponding quadrants of single faults also occurs, the interaction of the neighboring faults or fault segments amplifies the magnitudes and the area of influences of these perturbations.

Stress distribution at and around echelon shear fractures with the configuration at (a) and (b). Distribution of the mean stresses normalized by the far-field values in and around a left- and right-step, respectively, of right-lateral fractures is also shown. (c and d) Distribution of maximum shear stresses normalized by their far field values for the same fracture configurations is also shown as contours and tick marks show the direction of the local minimum compressive stresses. From Segall and Pollard (1980).Figure 3. Stress distribution at and around echelon shear fractures with the configuration at (a) and (b). Distribution of the mean stresses normalized by the far-field values in and around a left- and right-step, respectively, of right-lateral fractures is also shown. (c and d) Distribution of maximum shear stresses normalized by their far field values for the same fracture configurations is also shown as contours and tick marks show the direction of the local minimum compressive stresses. From Segall and Pollard (1980).

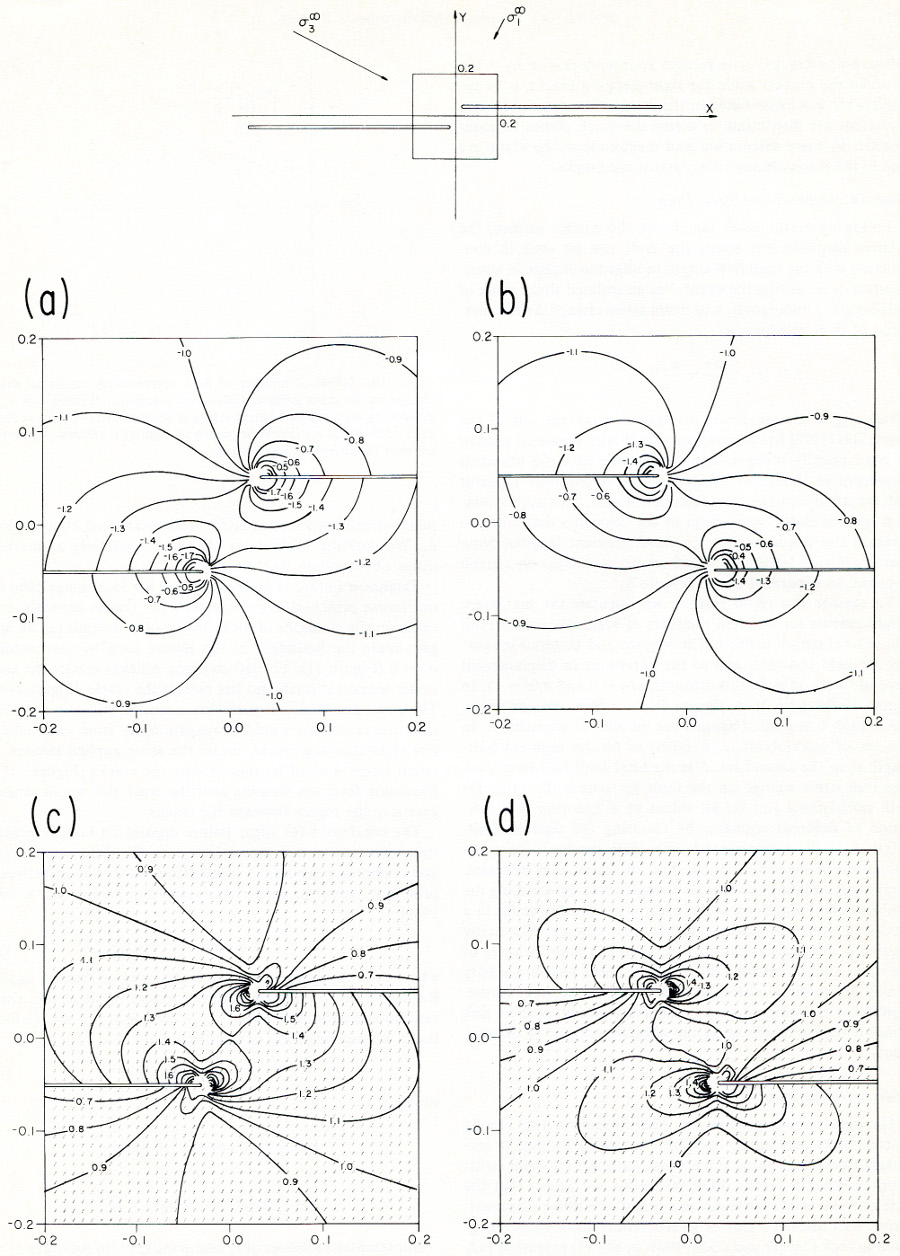
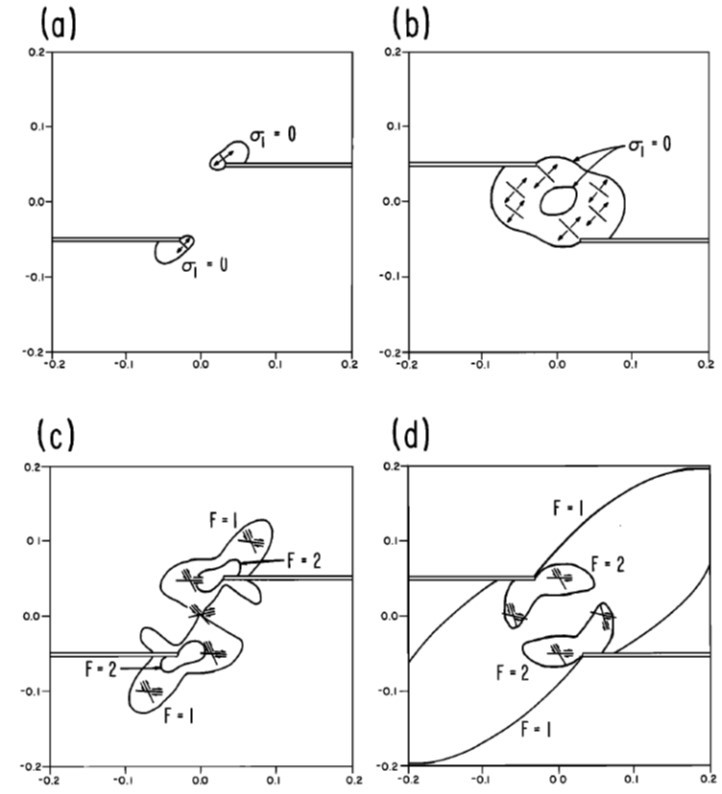
The specific structure types around the echelon faults are variable. Segal and Pollard (1980) calculated the orientations and distributions of the principal stresses, maximum shear stresses, and mean stresses associated with the interacting echelon strike-slip faults. Although the dominant secondary structures that these authors considered were joints associated with mode-II fractures readily applied to strike-slip faults (Figure 4), it is possible that under different boundary conditions and rock behavior, normal or thrust faults may form at the stepover regions of echelon strike-slip faults. Perhaps the clearest manifestation of the extension at pull-apart basins is the subsidence due to the vertical component of the surface deformation.

Secondary fracturing at and around echelon shear fractures with right-lateral slip as shown in the inset in Figure 3. (a and b) Distribution of the greatest tension for a left- and right-step, respectively. Some representative planes subjected to the greatest tension are shown. (c and d) Contours of shear failure (F) for a left- and right-step, respectively. The Coulomb failure criterion is used. Some representative failure orientations and sense of shear are shown. From Segall and Pollard (1980).Figure 4. Secondary fracturing at and around echelon shear fractures with right-lateral slip as shown in the inset in Figure 3. (a and b) Distribution of the greatest tension for a left- and right-step, respectively. Some representative planes subjected to the greatest tension are shown. (c and d) Contours of shear failure (F) for a left- and right-step, respectively. The Coulomb failure criterion is used. Some representative failure orientations and sense of shear are shown. From Segall and Pollard (1980).

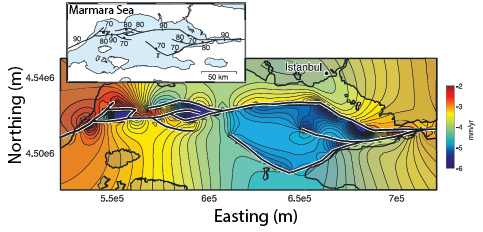
Figure 5 illustrates one of the spectacular examples from the Marmara Sea basin along the North Anatolian Fault (Muller and Aydin, 2005). Here, the surface morphology of the three basins are determined using fault geometry proposed by Armijo et al. (2002) among others. The model boundary conditions are based on the distribution and direction of the slip on the bounding faults related to the right-lateral plate boundary motion. The model results match reasonably well the bathymetry and the available seismic data from the basin. Please see the 'Echelon Faults' link for these products and interaction of faults with different kinematics.

Analysis of the Marmara Sea basin vertical displacement rate derived from fault slip and the North Anatolian Fault plate boundary motion. The three basins from east to west are the Cinarcik, Central Marmara, and Tekirdag. The model prediction matches reasonably well with the bathymetry of the basin. From Muller and Aydin (2005).Figure 5. Analysis of the Marmara Sea basin vertical displacement rate derived from fault slip and the North Anatolian Fault plate boundary motion. The three basins from east to west are the Cinarcik, Central Marmara, and Tekirdag. The model prediction matches reasonably well with the bathymetry of the basin. From Muller and Aydin (2005).

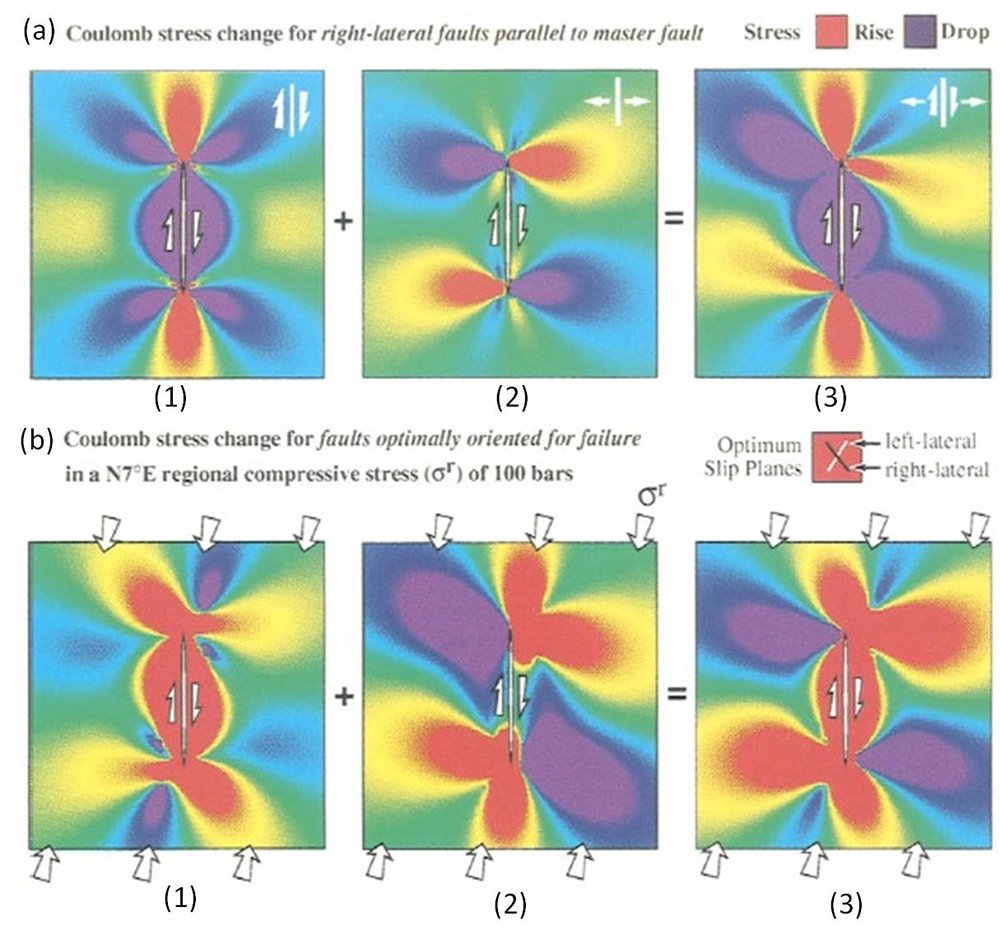
Perhaps the most convincing examples of fault interaction come from earthquake seismology. The diagrams in Figure 6 show a vertical fault in half space or map view of a strike-slip fault and changes of various stresses after the failure of the fault (King et al., 1984). They illustrate the concept by analyzing Coulomb stress change across planes parallel to the master strike-slip fault. Figures 6(a-1) and 6(a-2) show right-lateral shear stress change and the product of effective friction times normal stress change, respectively, as increases (rise) and decreases (drop). Figure 6(a-3) shows the right-lateral Coulomb stress change which is the product of the two in (a-1) and (a-2). The three diagrams in Figure 6(b) show the same changes (b-1, b-2, b-3) for faults with the same right-lateral sense optimally oriented for failure under a regional compression of 100 bars rotated 7 degrees clockwise from the orientation of the master fault. Notice how the lobes of stress increases and decreases differ from those in Figure 6(a-1, a-2, a-3).

Fault interactions and Coulomb stresses. (a) Coulomb stress change across sub-parallel faults in response to a slip across a right-lateral strike-slip fault. (1) Right-lateral shear stress change; (2) effective friction times the normal stress change; and (3) right-lateral Coulomb stress change. (b) Coulomb stress changes in optimally oriented planes with a remote compressive stress of 100 bars. From King et al. (1984).Figure 6. Fault interactions and Coulomb stresses. (a) Coulomb stress change across sub-parallel faults in response to a slip across a right-lateral strike-slip fault. (1) Right-lateral shear stress change; (2) effective friction times the normal stress change; and (3) right-lateral Coulomb stress change. (b) Coulomb stress changes in optimally oriented planes with a remote compressive stress of 100 bars. From King et al. (1984).

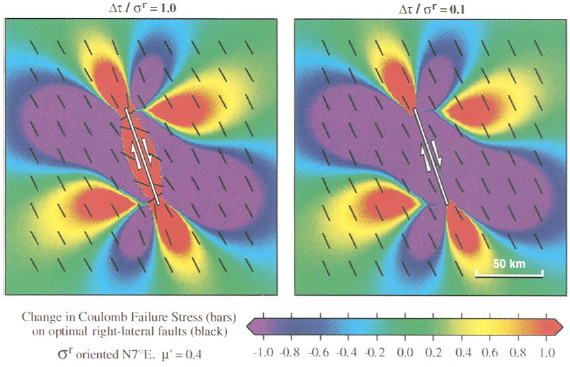
Figure 7 from the same authors includes two diagrams to show the dependence of the Coulomb stress change on the regional stress magnitude; one with the total stress drop or total stress release (left panel) and another with only ten percent of stress drop (right panel). Note that the optimal orientation of right-lateral faults becomes sub-parallel to the master fault in the small stress drop case.

Figures showing dependence of the Coulomb stress change on the regional stress magnitude. Thick marks represent the orientation of the optimum slip planes which are rotated nearly parallel with the slipping fault. From King et al. (1984).Figure 7. Figures showing dependence of the Coulomb stress change on the regional stress magnitude. Thick marks represent the orientation of the optimum slip planes which are rotated nearly parallel with the slipping fault. From King et al. (1984).

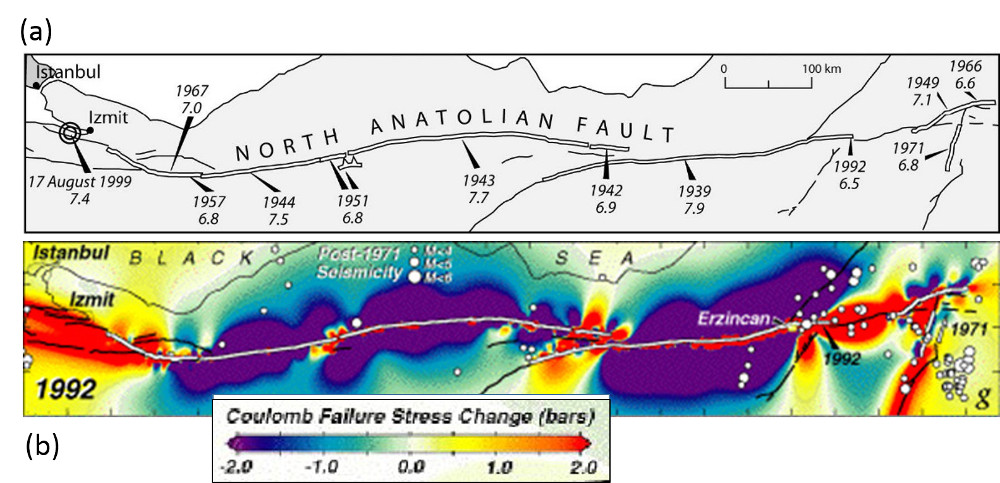
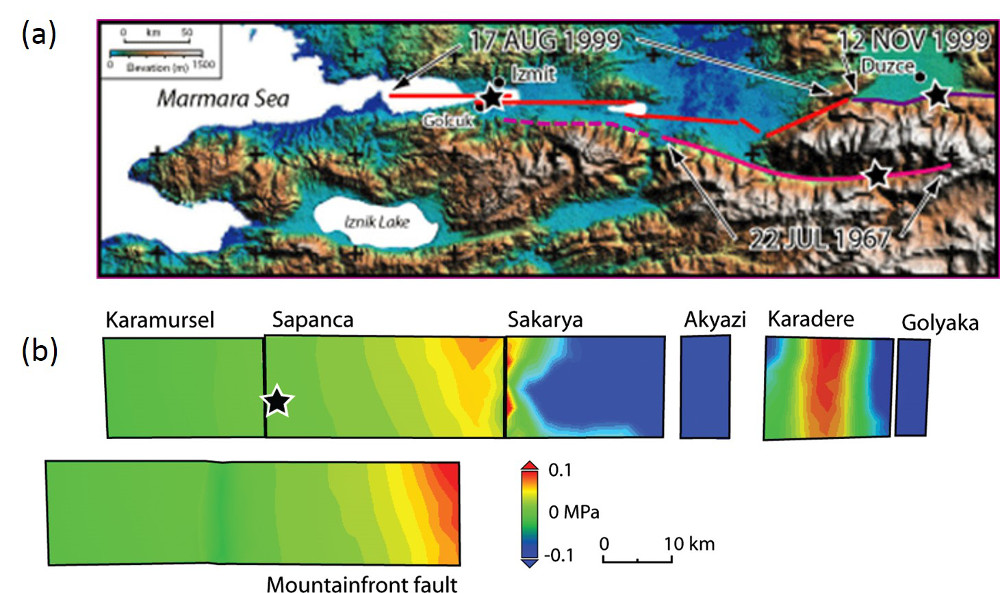
The best case study for fault interaction comes from the westward earthquake progression along the North Anatolian Fault, which has been known for some time. Stein et al. (1997) coined the 'stress triggering mechanism' for this remarkable sequence of seismic ruptures which started with the 1939 Erzincan earthquake and culminated with the 1999 Izmit Kocaeli earthquake (Figure 8a). Figure 8(b) shows the cumulative Coulomb Failure Stress change since the 1939 Erzincan earthquake until the 1999 Izmit earthquake along the North Anatolian Fault using sequential earthquake slip distribution in an elastic half-space model (from Stein et al., 1997). Figure 9(a) is the map of the surface rupture of the 1967 Mudurnu Valley earthquake and Figure 9(b) shows the calculated stress changes due to the earthquake prior to the 1999 Izmit earthquake using a 3-D boundary element method (Muller et al. 2003) supporting the stress triggering notion from one of the most recent earthquake sequences along the North Anatolian Fault.

(a) Westward earthquake progression along the North Anatolian Fault following the 1939 Erzincan earthquake. Years and ruptured segments are marked. Slightly modified from Stein et al. (1997) by Muller et al. (2003). (b) Cumulative Coulomb Failure Stress change since the 1939 Erzincan earthquake until the 1999 Izmit earthquake along the North Anatolian Fault using sequential earthquake slip distribution in an elastic half-space model. Red color code on either end of the activity correlates with increasing potential for failure. From Stein et al. (1997).Figure 8. (a) Westward earthquake progression along the North Anatolian Fault following the 1939 Erzincan earthquake. Years and ruptured segments are marked. Slightly modified from Stein et al. (1997) by Muller et al. (2003). (b) Cumulative Coulomb Failure Stress change since the 1939 Erzincan earthquake until the 1999 Izmit earthquake along the North Anatolian Fault using sequential earthquake slip distribution in an elastic half-space model. Red color code on either end of the activity correlates with increasing potential for failure. From Stein et al. (1997).
Transition from the 1967 Mudurnu Valley earthquake to the 1999 Izmit-Duzce earthquakes. (a) Surface rupture traces of the earthquake sequences. (b) The Coulomb failure stress change due to the July 22, 1967 Mudurnu Valley earthquake on the 1999 earthquake fault segments using a 3-D boundary element model with a friction coefficient of 0.6. From Muller et al. 2003.Figure 9. Transition from the 1967 Mudurnu Valley earthquake to the 1999 Izmit-Duzce earthquakes. (a) Surface rupture traces of the earthquake sequences. (b) The Coulomb failure stress change due to the July 22, 1967 Mudurnu Valley earthquake on the 1999 earthquake fault segments using a 3-D boundary element model with a friction coefficient of 0.6. From Muller et al. 2003.
Types of Interaction of Faults:
Material RotationFault Segment Linkage
Reference:

Armijo, R., Meyer, B., Navarro, S., King, G.C.P., Barka, A., 2002. Asymmetric slip partitioning in the Sea of Marmara pull-apart: A clue to propagation processes of the North Anatolian fault. Terra Nova 14: 80–86.

Aydin, A., Schultz, R.A., 1990. Effect of mechanical interaction on the development of strike-slip faults with echelon patterns. Journal of Structural Geology 12: 123-129.

King, G.C.P., Stein, R.S., Lin, J., 1984. Static stress changes and the triggering of earthquakes. Bulletin of the Seismological Society of America 84: 935-953.

Muller, J.R., Aydin, A., Maerten, F., 2003. Investigating the transition between the 1967 Mudurnu Valley and 1999 Izmit earthquakes along the North Anatolian fault with static stress changes. Geophys. J. Int. 154: 471-482.

Muller, J.R., Aydin, A., 2005. Using mechanical modeling to constrain fault geometries proposed for the northern Marmara Sea. Journal of Geophysical Research-Solid Earth 110: 283-302, B03407, doi:10.1029/2004JB003226.

Segall, P., Pollard, D.D., 1980. Mechanics of discontinuous faults. Journal of Geophysical Research 85: 4337-4350.

Stein, R.S., Barka, A., Dieterich, J.H., 1997. Progressive failure on the North Anatolian fault since 1939 by earthquake stress triggering. Geophys. J. Int. 128: 594–604.


Readme    |    About Us    |    Acknowledgement    |    How to Cite    |    Terms of Use    |    Ⓒ Rock Fracture Knowledgebase