| ||||||||||||
|
|
||||||||||||
|
|
||||||||||||
| Joint Aperture Distribution | ||||||||||||
|
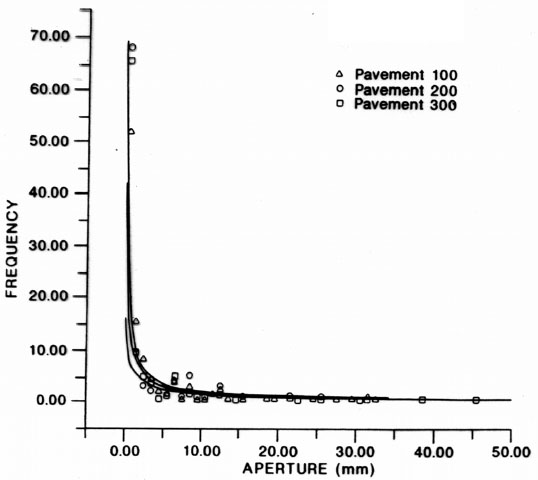
Aperture of joints is normally their smallest dimension and represents the displacement discontinuity across joints. If a joint is open, this parameter represents its aperture crucial for fluid flow along a joint as 'Joint Aperture.' Partly because aperture is generally quite small and partly because it is highly sensitive to effective normal stress, it therefore may vary in space and time. As opposed to the length and height distributions which do not change much after the formation of joint arrays, aperture varies with respect to joints' orientation. Nevertheless, attempts have been made to measure joint aperture in outcrops when it is relevant to near surface applications. For example, Figure 1 shows a frequency plot of a high number of aperture measurements in three pavements of tuffaceous rocks in Yucca Mountain, Nevada, which was once a leading candidate for the nation's nuclear waste repository. According to Barton and Hsieh (1989), the best fit curve to the data has a power-law form with an average exponent of 0.99.
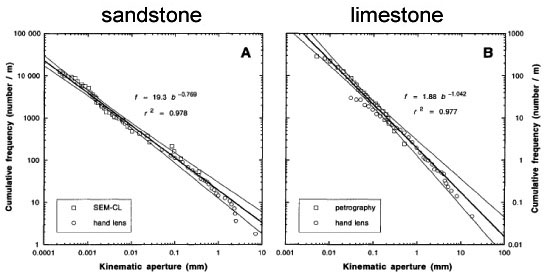
More accurate techniques such as petrographic microscope and SEM with cathode luminescence detector have been employed for laboratory measurements of aperture across joints and veins in a wide range of sizes. Similar to the conclusion reported above, a power-law distribution form has been proposed by Marrett et al. (1999) for fractures scaling across several orders of magnitude in a variety of rock types (Figure 2).
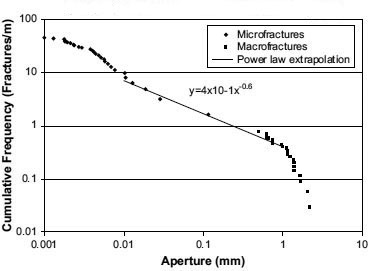
However, one of the recent studies from the same research group (Hooker et al., 2009) has concluded that the smallest and largest size range of fractures are best characterized by log-normal distribution while only the intermediate range can be characterized by a power-law distribution (Figure 3). These authors have interpreted the variation from the smallest to intermediate sizes in terms of the increasing effect of fracture interaction and the transition from the intermediate to larger size population and to the restriction provided by bed thickness. It appears that the notion of different distribution forms for different size and/or progressive development stages of joint arrays is a common signature rather than the exception.
| ||||||||||||
| Reference: |
||||||||||||
| Barton, C.C., Hsieh, P.A., 1989 Hooker, J.N., Gale, J.F.W., Gomez, L.A., Laubach, S.E., Marrett, R., Reed, R.M., 2009 Marrett, R., Ortega, O.J., Kelsey, C.M., 1999 |
||||||||||||
|
Readme | About Us | Acknowledgement | How to Cite | Terms of Use | Ⓒ Rock Fracture Knowledgebase |
||||||||||||