| |||||||||
|
|
|||||||||
|
|
|||||||||
| Joint Length Distribution | |||||||||
|
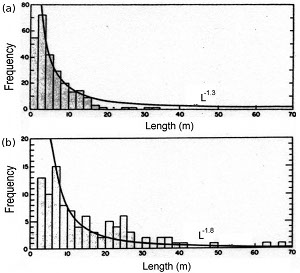
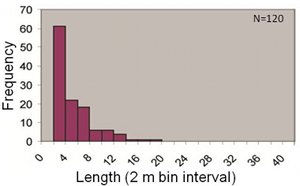
In the literature, there are plenty of joint frequency-length distribution data but only few of these in which the fracture mode and the state of joint evolution have been confidently determined. One of these efforts is by Segall and Pollard (1983) from granitic rocks of the central Sierra Nevada Mountains of California. Figures 1(a) and (b) are length distribution plots for joints well exposed on glaciated pavements at two different locations. The measured values of joint lengths span from about 1 m which is the map resolution to about 70 m and show possible power-law distributions with powers of -1.3 and -1.8. A similar power-law distribution is presented in Figure 2 for joint lengths in an aeolian sandstone exposed at Valley of Fire State Park, Nevada.
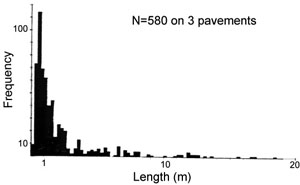
Another example shown in Figure 3 is by Barton and Larsen (1985) from three pavements of tuffaceous volcanic ash of Yucca Mountain, Nevada. Here the distribution is best characterized by log-normal according to the authors.
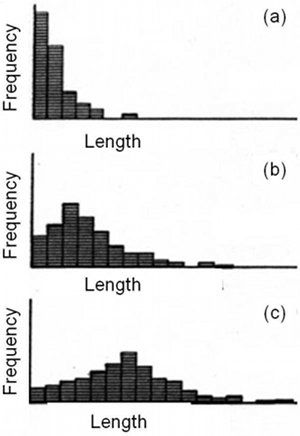
Even though quite accurate, all of these data sets have inherit problems common to most outcrop data collection as noted by the authors themselves: under-sampling very small and very large intervals due to the lack of visibility or representation of the joints at the smaller end of scale and the limited size of the outcrops to sample long joints at the larger end of the scale, just to highlight a few. Thus, we turn to experimental data for which the resolution is better and the distribution forms as joints grow under increasing strain are readily available. Figure 4 contains summary diagrams from Wu and Pollard (1992) which show joint length distribution forms from an early cycling level (a) through an intermediate level (b) and finally to an advanced level (c) beyond which the length parameter does not change significantly and the level is known as the saturation stage. In this stage, much of the additional strain is accommodated by further opening of the joints rather than the formation of new joints and lengthening of the existing ones. The trend in Figure 4 marks the evolution of joint arrays from a possible power-law to log-normal and eventually stabilizes at a normal distribution form. See a similar evolution for joint spacing. | |||||||||
| Reference: |
|||||||||
| Barton, C.C., Larsen, E., 1985 Segall, P., Pollard, D.D., 1983 Wu, H., 1991 Wu, H., Pollard, D.D., 1992 |
|||||||||
|
Readme | About Us | Acknowledgement | How to Cite | Terms of Use | Ⓒ Rock Fracture Knowledgebase |
|||||||||


