Rock Fracture
KNOWLEDGEBASE
  

Joint Spacing - Layer Thickness Scaling

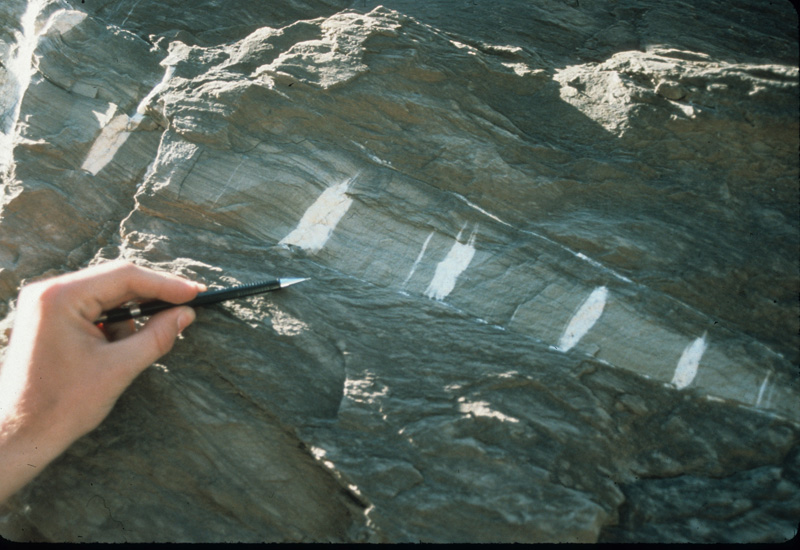
It is a common knowledge that the spacing of joints is somewhat proportional to the thickness of the layers in which they occur. Field examples for supporting this notion are abundant: Figure 1 shows a vein set in a limestone unit which thickens from right to left. Similarly the spacing of the veins appears to increase from the thinner part of the unit on the right side of the image to the thicker part on the left side.

Fracture (vein) spacing in a limestone layer within a carbonaceous shale, Tennessee. Note that the thickness of the limestone layer increases towards the left as does the vein spacing.Figure 1. Fracture (vein) spacing in a limestone layer within a carbonaceous shale, Tennessee. Note that the thickness of the limestone layer increases towards the left as does the vein spacing.

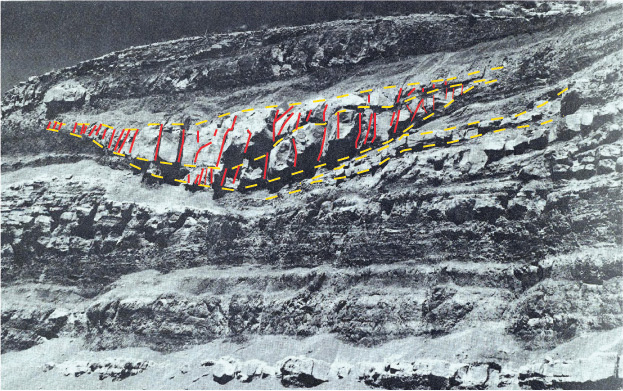
Figure 2 contains a well-developed systematic joint set which, unfortunately, is somewhat oblique to the surface of the cut. Nevertheless, the joint separations on the surface of the exposure decrease toward the perimeters of the sandstone lenses defined by the depositional channel geometry.

Joint systems (red) in sandstone beds (bed interfaces yellow) in a fluvial sequence near Price, Utah. Note that the fractures which are somewhat oblique to the cliff face generally occur in sandstones. Of interest is the decreasing apparent joint spacing in sandstone lenses towards their perimeters as their thicknesses diminish. The thickness of the mapped units at the center is ~2 m. Photo from Hamblin (1982) and Christiansen and Hamblin http://earthds.info/pdfs/EDS_07.PDFFigure 2. Joint systems (red) in sandstone beds (bed interfaces yellow) in a fluvial sequence near Price, Utah. Note that the fractures which are somewhat oblique to the cliff face generally occur in sandstones. Of interest is the decreasing apparent joint spacing in sandstone lenses towards their perimeters as their thicknesses diminish. The thickness of the mapped units at the center is ~2 m. Photo from Hamblin (1982) and Christiansen and Hamblin http://earthds.info/pdfs/EDS_07.PDF

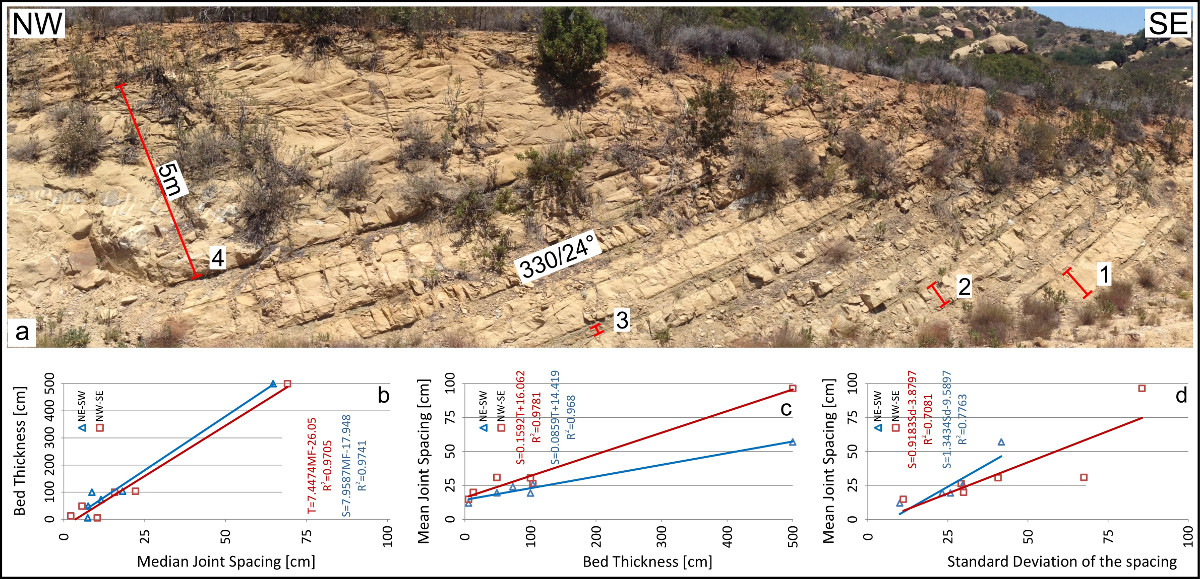
Finally, Figure 3 shows scanline data from two systematic joint sets in seven sandstone beds with various thicknesses exposed on a road cut (a). Figures 3b, 3c, and 3d show the fracture spacing ratio (FSR- the ratio of median spacing over the layer thickness), the fracture spacing/layer thickness ratio (S/T), and the ratio of the standard deviation of joint sets data and their mean values (CV). In general the data sets indicate a positive correlation between the spacing and the thickness of the mechanical layers in which they occur. The obvious reason for choosing the field cases presented above is that the material properties, the loading, and the total strain for each particular case do not change much if any so that these factors can be taken as constant for each case. However, several other factors influence joint spacing in layered rocks as will be discussed somewhere else in this Knowledgebase.

a) Outcrop picture where beds 1 to 4 (bed-parallel) were scanline surveyed. Note bed attitude. b) FSI; c) S/T; d) Cv which shows relationships between joint spacing and bedding thickness in various forms. From Cilona et al. (2016).Figure 3. a) Outcrop picture where beds 1 to 4 (bed-parallel) were scanline surveyed. Note bed attitude. b) FSI; c) S/T; d) Cv which shows relationships between joint spacing and bedding thickness in various forms. From Cilona et al. (2016).

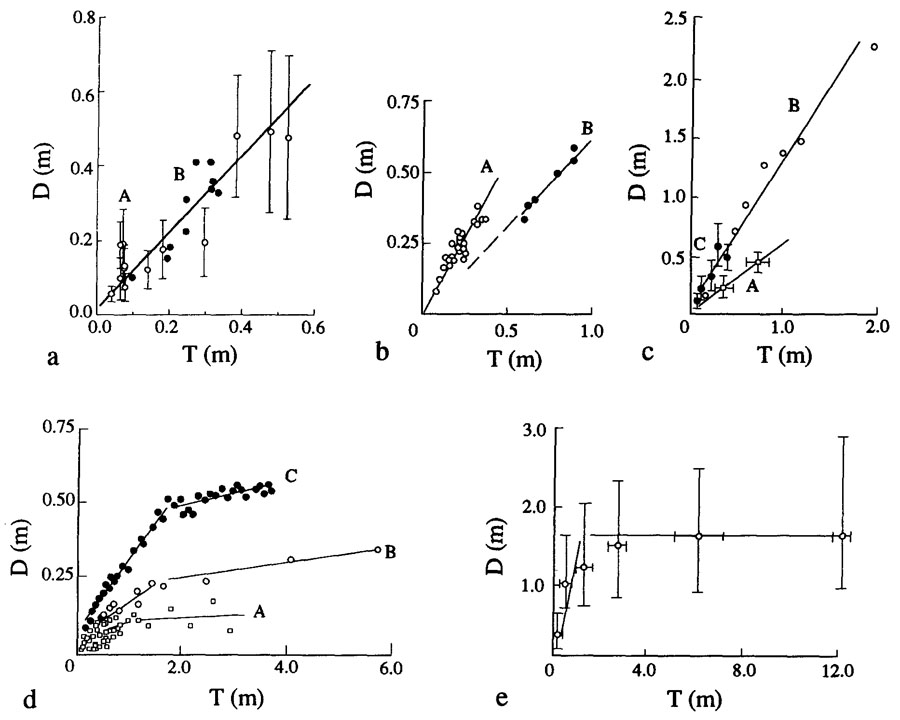
Let's now consider joint spacing-layer thickness relationship data from the literature. Figure 4 is a summary of joint spacing/layer thickness data from the literature (Wu and Pollard, 1995) with individual credit given in the figure caption. Basically, there are two trends in spacing - layer thickness relationships: linear (Figures 4a-c) for thin beds and initially linear followed by nearly constant (Figures 4d, e) for thick beds. For layer thickness exceeding a certain value, a simple linear spacing-thickness relationship does not hold and a constant spacing is maintained beyond this critical value. This critical value is approximately 1.5 meters (Figures 4d-e). According to Price and Cosgrove (1990), beyond this value, spacing is independent of the thickness of layers; on the other hand, in thin layers, spacing is strongly influenced by tractions across the competent/incompetent rock interfaces.

The relationships between joint spacing, D, and bed thickness, T, presented by different authors. (a) Clayey-siliceous member of the Miocene Monterey Formation at Gaviota, California, USA. A: data with error bars from Wu and Pollard 1995; B: data (solid dots) from Gross (1993). (b) Limestones from Bevons syncline, near Sisteron, southern France (after Huan and Angelier 1989). A: Albian limestones; B: Neocomian limestones. (c) Two different lithologies from Russia (Bogdanov 1947, Novikova 1947, Kirillova 1949, after Price 1966). A, B: sandstones; C: limestone. (d) A: Portuguese greywacke; B: U.K. greywacke; C: U.K. greywacke (after Ladeira and Price 1981). (e) Asmari limestone, Iran (after McQuillan 1973).Figure 4. The relationships between joint spacing, D, and bed thickness, T, presented by different authors. (a) Clayey-siliceous member of the Miocene Monterey Formation at Gaviota, California, USA. A: data with error bars from Wu and Pollard 1995; B: data (solid dots) from Gross (1993). (b) Limestones from Bevons syncline, near Sisteron, southern France (after Huan and Angelier 1989). A: Albian limestones; B: Neocomian limestones. (c) Two different lithologies from Russia (Bogdanov 1947, Novikova 1947, Kirillova 1949, after Price 1966). A, B: sandstones; C: limestone. (d) A: Portuguese greywacke; B: U.K. greywacke; C: U.K. greywacke (after Ladeira and Price 1981). (e) Asmari limestone, Iran (after McQuillan 1973).

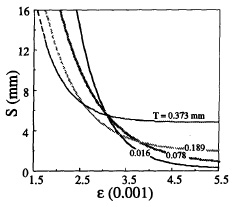
Among the linear relations, different slopes are observed. This indicates a range of values for joint spacing-layer thickness ratio. The values proposed in the literature fall into a narrow range, from about 0.9 to 1.3 for a specific formation (Narr and Suppe, 1991). Compilations from various studies dealing with various rock types and locations define a wider range, from 0.1 to greater than 10 (Bai et al., 2000). The slopes characterizing the linear spacing/thickness relationships apparently are a function of lithology (Figure 4c), mechanical properties of the fractured layers as well as of the interface or the surroundings of the fractured layers, and structural position which implies local stress and strain variations (Figure 4b).

Laboratory studies provide more reliable information about the relationship between joint spacing and layer thickness since it is not always possible to determine strains the rocks undergo during natural fracturing. The plots in Figure 5 obtained by Wu (1993) and Wu and Pollard (1995) show a consistently higher spacing corresponding to thicker brittle coatings used in their experiments. The critical value of the fracture spacing to layer thickness ratio increases with: (1) increasing ratio of Young's modulus of the fractured layer to that of the neighboring layers, (2) increasing Poisson's ratio of the fractured layer, and (3) increasing overburden stress (depth), but it decreases with increasing Poisson's ratio of the neighboring layers.

Least square fitting of spacing vs. applied strain for four different thicknesses of brittle coating experiments. The relationship between spacing and strain is a non-linear decreasing function which apparently approaches successively greater asymptotes of constant spacing for greater thicknesses. From Wu (1993).Figure 5. Least square fitting of spacing vs. applied strain for four different thicknesses of brittle coating experiments. The relationship between spacing and strain is a non-linear decreasing function which apparently approaches successively greater asymptotes of constant spacing for greater thicknesses. From Wu (1993).

Disscussion for mechanisms of spacing to layer thickness can be found in 'Growth of Joint Array - Fracture Saturation.'

Reference:

Bai, T., 1999. Closely Spaced Fractures in Layered Rocks: Implications for Fluid Flow. Stanford Digital Repository. Available at: http://purl.stanford.edu/pm227qs1839.

Bai, T., Pollard, D.D., Gao, H., 2000. Explanation for fracture spacing in layered materials. Nature 403 (6771): 753-756.

Cilona, A., Aydin, A., Likerman, J., Parker, B., Cherry, J., 2016. Structural and statistical characterization of joints and multi-scale faults in an alternating sandstone and shale turbidite sequence at the Santa Susana Field Laboratory: Implications for their effects on groundwater flow and contaminant transport. Journal of Structural Geology 85: 95-114, http://dx.doi.org/10.1016/j.jsg.2016.02.003.

Gross, M.R., 1993. The origin and spacing of cross joints: examples from the Monterey Formation, Santa Barbara coastline, California. Journal of Structural Geology 15: 737-751.

Huang, Q., Angelier, J., 1989. Fracture spacing and its relation to bed thickness. Geology Magazine 126: 355-362.

Lachenbruch, A.H., 1962. Mechanics of thermal contraction cracks and ice-wedge polygons in permafrost. Geological Society of America Special Paper 70, 69 p.

Laderira, Price, N.J., 1981. Relationship between fracture spacing and bed thickness. Journal of Structural Geology 3: 179-183.

McQuillan, H., 1973. Small-scale fracture density in Asmari formation of Southwest Iran and its relation to bed thickness and structural setting. American Association of Petroleum Geologists Bulletin 57: 2367-2385.

Narr, W., Suppe, J., 1991. Joint spacing in sedimentary rocks. Journal of Structural Geology 11: 1037-1048.

Price, N.J., Cosgrove, J.W., 1990. Analysis of Geological Structures. Cambridge University Press, Cambridge.

Wu, H., 1993. On joint spacing, layer thickness, and fracture saturation. Stanford Digital Repository. Available at: http://purl.stanford.edu/rh695gx5888.

Wu, H., Pollard, D.D., 1995. An experimental study of the relationship between joint spacing and layer thickness. Journal of Structural Geology 17 (6): 887-905.


Readme    |    About Us    |    Acknowledgement    |    How to Cite    |    Terms of Use    |    Ⓒ Rock Fracture Knowledgebase