Rock Fracture
KNOWLEDGEBASE
  

Growth of Joint Arrays - Fracture Saturation and Fracture Infilling

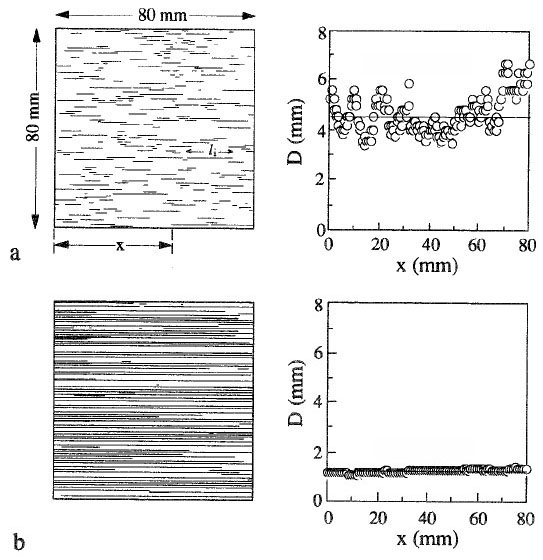
There are two very important concepts related to the growth of joint arrays or sets. One of these is the notion of fracture saturation (see Figure 1) which corresponds to a critical level of joint production beyond which the number of joints does not change appreciably and the additional extension is accommodated by increasing joint aperture. In layered rocks, in which layering may be due to either depositional or mechanical processes, joint spacing to layer thickness ratio appears to level off around 1 for well developed joint systems. In such systems the spacing or density of joints is controlled by the height of the joints. The basis of this rule is known as the stress shadow which is a zone of stress relief around a fracture, the width of which scales with the height of the fracture (Lachenbruch, 1962; Nur, 1982) as presented somewhere else in this Knowledgebase.

Joint spacing in a pair of samples fractured in the laboratory under controlled conditions. (a) A poorly developed system, and (b) a well-developed system or saturation state. From Wu and Pollard (1995).Figure 1. Joint spacing in a pair of samples fractured in the laboratory under controlled conditions. (a) A poorly developed system, and (b) a well-developed system or saturation state. From Wu and Pollard (1995).

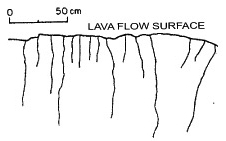
Perhaps the best example of this phenomenon can be seen in the so-called joint elimination in an array of joints initiating from a surface or boundary and growing towards the interior of the medium in such a way that the relief zone width or joint spacing increases by systematic termination of certain other joints (Figures 2a and b). Figure 2c is a plot showing the normalized opening mode fracture propagation energy at one of the tips (the upper tip in this case, however, the problem is symmetric) of initial fractures assumed to be the same length (2a) and spacing (2b) for a certain incremental extension (2c) of the central fracture (number zero). As the ratio of c/a increases from 0.2 to 2.0, the relative propagation energy associated with the joints closer to the central fracture decreases systematically (DeGraff, 1987) implying that the closer fractures are less likely to propagate than those farther away marked by higher numbers.

Evolution of spacing of an array of joints initiating from a surface. Spacing increases by a process referred to as joint elimination. (a) A thermal joint array in volcanic rock (DeGraff, 1987), (b) an array of tectonic joints in sedimentary rock (Helgeson and Aydin, unpublished data), (c) relative joint propagation energy associated with an array of fractures next to the one fracture which grew an increment (DeGraff and Aydin, 1993). Those fractures near the one which grew have lower propagation energy and the decrease in the propagation energy is proportional to the growth increment.Figure 2. Evolution of spacing of an array of joints initiating from a surface. Spacing increases by a process referred to as joint elimination. (a) A thermal joint array in volcanic rock (DeGraff, 1987), (b) an array of tectonic joints in sedimentary rock (Helgeson and Aydin, unpublished data), (c) relative joint propagation energy associated with an array of fractures next to the one fracture which grew an increment (DeGraff and Aydin, 1993). Those fractures near the one which grew have lower propagation energy and the decrease in the propagation energy is proportional to the growth increment.

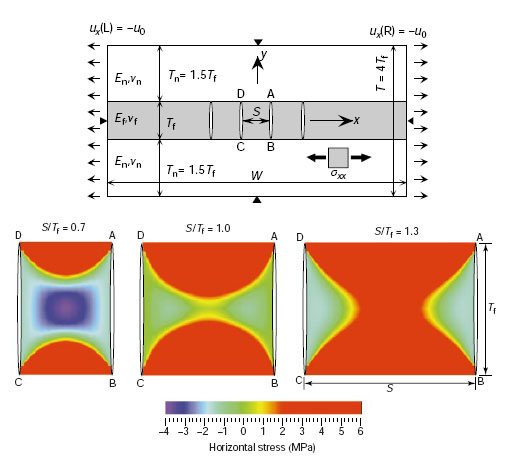
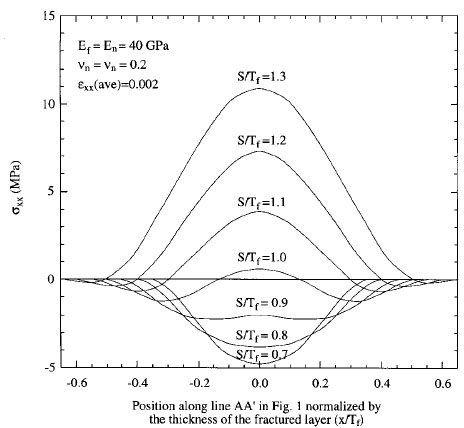
There are two processes in play in the evolution of joint spacing: One is related to in-plane joint propagation due to stress concentration at existing joints tips and the other has to do with the initiation of new joints in between existing subparallel joints, which is often referred to as joint infilling. It turns out that there is a limit for joint infilling (Bai and Pollard, 1999) corresponding to the state of joint saturation. Bai (1999) and Bai and Pollard (2000) showed based on their numerical modeling results that when joint spacing to layer thickness ratio changes from greater than a critical value to less than that, the normal stresses acting perpendicular to the joints within the slab between the neighboring joints change from tensile to compressive (Figure 3 and Figure 4). This switch in the stress state precludes further joint infilling.

Illustration on the top shows the finite element model as well as its boundary conditions with four joints of spacing s in the fractured layer. Figures on the bottom are contour plots of the horizontal stress perpendicular to the joints (delta xx) in the fractured layer between the two middle fractures (area ABCD) at different fracture-spacing-to-layer-thickness ratio. Note the stress changes sign as the spacing-to-layer-thickness ratio changes from less than to greater than about 1.0. From Bai (1999).Figure 3. Illustration on the top shows the finite element model as well as its boundary conditions with four joints of spacing s in the fractured layer. Figures on the bottom are contour plots of the horizontal stress perpendicular to the joints (delta xx) in the fractured layer between the two middle fractures (area ABCD) at different fracture-spacing-to-layer-thickness ratio. Note the stress changes sign as the spacing-to-layer-thickness ratio changes from less than to greater than about 1.0. From Bai (1999).
Distributions of the normal stress component as a function of fracture spacing to layer thickness ratio. The x-axis is the position in the direction perpendicular to the fractures along a line at the middle line of two adjacent joints in cross section. The figure shows that there is a critical spacing to layer thickness ratio between 0.9 and 1.0, which marks the stress state transition. When the spacing to layer thickness ratio is less than the critical Value, the stress is compressive; however, when it is greater than the critical has, the stress in the middle of the plotted line becomes tensile. From Bai (1999).Figure 4. Distributions of the normal stress component as a function of fracture spacing to layer thickness ratio. The x-axis is the position in the direction perpendicular to the fractures along a line at the middle line of two adjacent joints in cross section. The figure shows that there is a critical spacing to layer thickness ratio between 0.9 and 1.0, which marks the stress state transition. When the spacing to layer thickness ratio is less than the critical Value, the stress is compressive; however, when it is greater than the critical has, the stress in the middle of the plotted line becomes tensile. From Bai (1999).
Reference:

Bai, T., 1999. Closely Spaced Fractures in Layered Rocks: Implications for Fluid Flow. Stanford Digital Repository. Available at: http://purl.stanford.edu/pm227qs1839.

Bai, T., Pollard, D.D., 2000. Fracture spacing in layered rocks: a new explanation based on the stress transition. Journal of Structural Geology 22 (1): 43-57.

DeGraff, J.M., 1987. Mechanics of columnar joint formation in igneous rocks. PhD Thesis, Purdue University.

DeGraff, J.M., Aydin, A., 1993. Effect of thermal regime on growth increment and spacing of contraction joints in basaltic lava. Journal of Geophysical Research - Solid Earth 98 (B4): 6411-6430.

Lachenbruch, A.H., 1962. Mechanics of thermal contraction cracks and ice-wedge polygons in permafrost. Geological Society of America Special Paper 70, 69 p.

Nur, A., 1982. The origin of tensile fracture lineaments. Journal of Structural Geology 4: 31-40.

Wu, H., 1993. On joint spacing, layer thickness, and fracture saturation. Stanford Digital Repository. Available at: http://purl.stanford.edu/rh695gx5888.

Wu, H., Pollard, D.D., 1995. An experimental study of the relationship between joint spacing and layer thickness. Journal of Structural Geology 17 (6): 887-905.


Readme    |    About Us    |    Acknowledgement    |    How to Cite    |    Terms of Use    |    Ⓒ Rock Fracture Knowledgebase