| |||||||||
|
|
|||||||||
|
|
|||||||||
| Joint Spacing Affected by Rock Subcritical Index | |||||||||
|
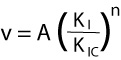
Previous works show that the value of the subcritical index exerts a strong influence on the spatial arrangement of joints. For example, Renshaw and Pollard (1994) presented a physically based network simulator based on iterative solutions for the evolution of a single set of planar, parallel joints in a plate subjected to a constant remote stress and compared the numerical results with experimental results. They found that the clustering of joints is sensitive to the velocity exponent (subcritical index) and less sensitive to the flaw density. With increasing value of subcritical index, the joint propagation velocity is increasingly dependent upon the stress intensity at the joint tip. Then, by 3D numerical simulation, Olson (2004) demonstrated the strong influence of subcritical index on the spatial arrangement (set spacing) and length distribution of joints when they undergo subcritical propagation. The importance of subcritical growth for geological situations is that it is a stable propagation mechanism, in which the propagation velocity, v, is related to the opening-mode stress intensity factor at the crack tip, K(I), with an empirically quantifiable, power-law relationship (Equation 1). In Equation 1, K(IC) is the critical mode-I (opening mode) fracture toughness, n is the subcritical index, and A is proportionality constant. The power-law exponent, n, can vary widely depending on rock type and environmental conditions (such as dry vs. wet). The higher the value of the subcritical index, the less important subcritical growth becomes, as very little propagation occurs before the fracture toughness is reached. For a given rock type, the subcritical index typically decreases with increasing water content in the environment. Reported values for the exponent, n, vary from 20 or less for tests carried out on sandstone submerged in water to greater than 250 under dry conditions in carbonate. Work in clastic sedimentary rocks suggests that grain size, grain mineralogy, cement type, and porosity can influence the value of the subcritical index for a given environmental condition.
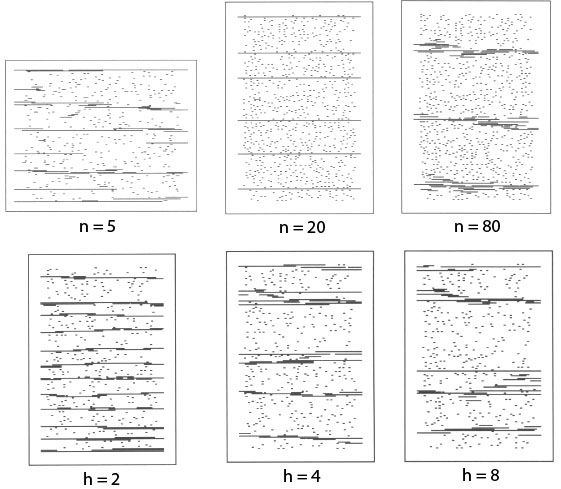
The initial setting of the Olson (2004) simulation was run with 400 or 800 randomly located starter flaws, all with a length of 0.2 m and height equal to the layer thickness. Besides the subcritical fracture-propagation rule shown in Equation 1, Olson's numerical simulation also accounts for the three dimensional mechanical interaction between simultaneously propagating fractures. Figure 1 summarizes the trace maps of the simulated fracture patterns. Using subcritical index of 5 (top left of Figure 1), an irregularly spaced fracture pattern was generated with a large variety of fracture lengths. The average spacing is much less than the bed thickness. Using a higher subcritical index of 20 (top center of Figure 1) significantly reduced the number of fractures, but resulted in longer fracture lengths. The spacing became more regular and systematic, with an average spacing of about 75% of the bed thickness. High sub-critical index, i.e., 80 (top right of Figure 1), results in joint clusters or joint zones made up of many closely spaced short fractures. The development of this pattern through time involved clusters of smaller fractures propagating simultaneously at the tip region of larger fractures. However, this result is in contrast to previous work by Renshaw and Pollard (1994), which predicts a regularly sparsely spaced joint pattern with high index.
Olson (2004) also studied the mechanism of clustering to the high subcritical index case as related to the magnitude of the stress intensity factor when propagation occurs. As fracture-propagation velocities for material with very high subcritical index are initially very low due to the power-law nature, propagation is delayed until more strain has accumulated. Consequently, when fracture growth finally occurs, it can be at stress intensity factor values that approach or exceed critical values. Because fracture-induced stress scales linearly with stress intensity factor in the near-tip region, the tensile stress perturbation around the tip is increased and the propagation of flaws is enhanced. The joint zone essentially records the movement of a process zone across the rock body. | |||||||||
| Reference: |
|||||||||
| Olson, J., 2004 Renshaw, C., Pollard, D.D., 1994 |
|||||||||
|
Readme | About Us | Acknowledgement | How to Cite | Terms of Use | Ⓒ Rock Fracture Knowledgebase |
|||||||||