| |||||||
|
|
|||||||
|
|
|||||||
| Localized Volume Reduction Model | |||||||
|
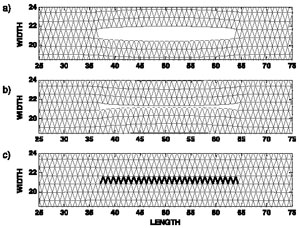
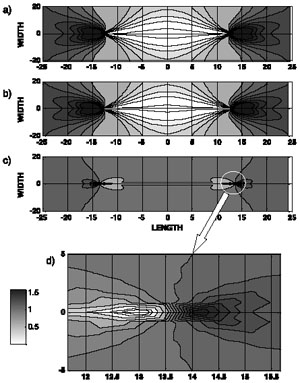
Katsman et al. (2006) presented a numerical tool using the spring network model to gain insight into the patterns of stress perturbation induced by localized volume reduction defects. Their result differs in an essential way from the main hypothesis of an anticrack by Fletcher and Pollard (1981). The spring network model (SNM) has the ability to model highly heterogeneous features and sharp discontinuities in material properties. In contrast to a finite element method (FEM) treatment of continuous partial differential equations used by Fletcher and Pollard, the SNM easily allows for a discrete distribution of material properties at a physically relevant scale. However, with the SNM, the transfer of stresses from a failed material region to another can only be modeled on the length scale of the spring or larger. Mode I and anti-mode I cracks are modeled by prescribing to springs stress thresholds in extension. If the force on a spring exceeds a critical value, the spring breaks and its Young's modulus is set to zero. Broken springs have no resistance to applied stress and effectively simulate broken matter (Figures 1a and 1b). Localized volume reduction is modeled similarly by prescribing permanent changes in spring properties in response to stress. Vertical compaction is modeled by removing a thin lamina of material from the original height. Numerically this is done by reducing the nonhorizontal spring's equilibrium length. In altered triangular units, the Young's modulus of the horizontal spring is tuned so that although the unit shortened vertically, it retained its original length (Figure 1c). When compressive force on a spring exceeds a critical value, then the equilibrium length is abruptly shortened to its new value. Stress perturbation in the form of normal stress contours is shown in Figure 2. The surface of mode I opening crack is characterized by a zero stress contour, while the maximum stress concentration occurs in peaks outside the crack tips only (Figure 2a). The local stress distribution around an anti-mode I closing crack is identical to that of an opening crack (Figure 2b), with opposite sign of remote stress. For local volume reduction, the stress along the defect is low. But as opposed to the crack and anti-crack case, the stress is greater than zero, except at the peak inside the defect tip, as seen in Figures 2c and 2d. A maximum and minimum stress concentration around the LVR defect occurs in two opposite peaks outside and inside the defect tips, respectively. Outside the defect tip, the level of stress elevation above the applied remote stress was constant and independent of defect length or applied stress. This stress concentration, however, did increase with the amount of volume removed from the defect. It is obvious that the stress distribution around the LVR defect is different from the stress around an opening or closing crack. Since stress concentrations at the tips of fractures are responsible for their growth and evolution, Katsman and coauthors' result have significantly different implications to the growth and interaction of LVR fractures than the anti-crack model. First, the stress concentration is independent of seam length, thus predicting that a pressure solution would maintain a constant growth rate, as opposed to accelerated growth rate of opening cracks. Then, since the area of enhanced stress concentration is much smaller in the LVR model than in the anti-crack model, the two adjacent LVR fractures would not interact until much closer than anti-cracks, implying a higher density or smaller spacing for a set of pressure solutions. | |||||||
| Reference: |
|||||||
| Fletcher, R.C., Pollard, D.D., 1981 Katsman, R., Aharonov, E., Scher, H., 2006 |
|||||||
|
Readme | About Us | Acknowledgement | How to Cite | Terms of Use | Ⓒ Rock Fracture Knowledgebase |
|||||||

