Rock Fracture
KNOWLEDGEBASE
  

Mechanisms and Mechanics of Pressure Solution Seams

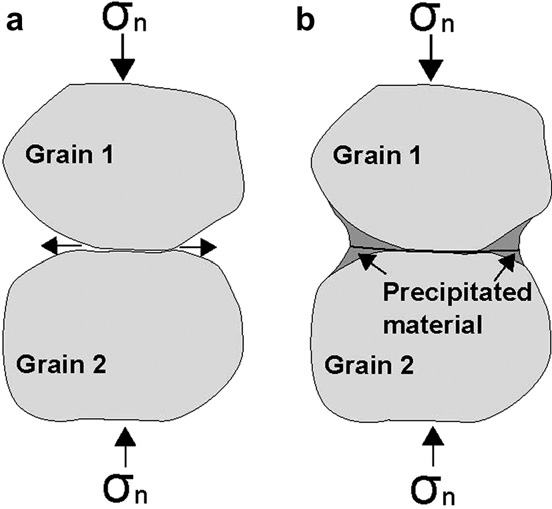
Pressure solution is a time-dependent process responsible for slow, ductile, irreversible deformation of rock. The process is more specifically known as intergranular pressure solution, which consists of three stages (Figure 1): (1) dissolution at contact areas or asperities subjected to high stresses, (2) diffusion/dispersion from high-stress areas to low-stress areas via thin fluid films along the contacts, driven primarily by the chemical potential, and (3) precipitation of the dissolved material at low-stress areas (Weyl, 1959; Rutter, 1983; Rennard and Dsythe, 2003). The undissolved minerals left behind usually define a thin zone referred to as a 'seam,' with various shapes and properties described in more detail in the link titled 'Pressure Solution Seams' at the end of this section under 'Related Concepts.' It is believed that dissolution continues to occur at the interface of the seam and the matrix grain.

Schematic diagram illustrating the concept of intergranular pressure solution in clastic rock. (a) Dissolution at the contact between two grains due to normal stress concentration, and (b) diffusion of the material into nearby pores. Simplified from Renard et al. (2003).Figure 1. Schematic diagram illustrating the concept of intergranular pressure solution in clastic rock. (a) Dissolution at the contact between two grains due to normal stress concentration, and (b) diffusion of the material into nearby pores. Simplified from Renard et al. (2003).

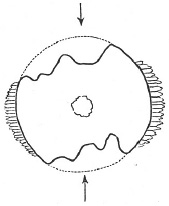
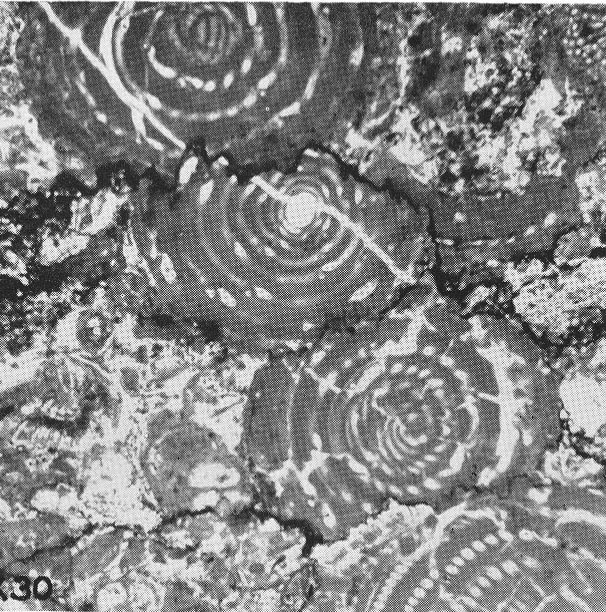
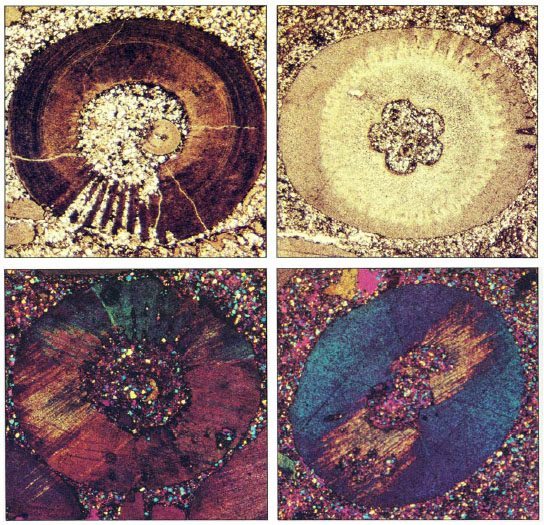
As early as 1879, Sorby reported that dissolution took place 'where there was great pressure and stress, and deposition where they were relatively less.' He supported his conclusion by a field example of Encrinites (Figure 2) showing some materials have been dissolved thereby altering their outline from the original (dotted lines), whilst the dissolved material has crystallized out on each side where protected (from high stresses). Later, Dunnington (1954) showed clear examples of interpenetration of fossil fragments along two or three branching pressure solution seams (dark bands in Figure 3). Engelder (1982) observed shape changes in crinoids from pressure solution in samples from western New York State (Figure 4). The initial round cross sectional shape of the crinoid columns was distorted to elliptical sections by pressure solution. The maximum compression is independently inferred to be parallel to the short axis of the ellipses based on other geological information.

Schematic illustration showing some joints of Encrinites dissolved, and the dissolved material recrystallized at areas where the stress is lower. From Sorby (1879).Figure 2. Schematic illustration showing some joints of Encrinites dissolved, and the dissolved material recrystallized at areas where the stress is lower. From Sorby (1879).
Photo showing fossil fragments deformed by pressure solution. From Dunnington (1954).Figure 3. Photo showing fossil fragments deformed by pressure solution. From Dunnington (1954).
Photos showing shape changes of crinoid columnals from different outcrops in western New York State. Each side of each photo is about 7 mm. From Engelder (1982).Figure 4. Photos showing shape changes of crinoid columnals from different outcrops in western New York State. Each side of each photo is about 7 mm. From Engelder (1982).

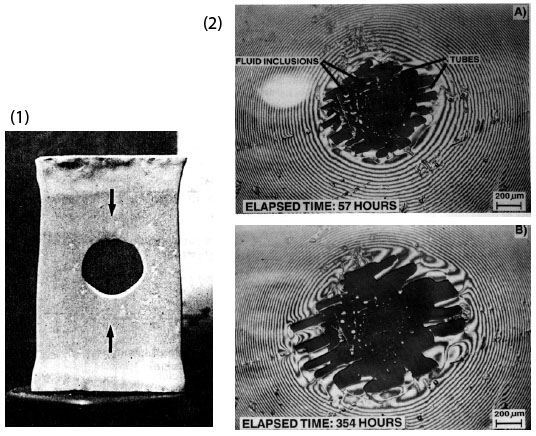
Pressure solution has also been verified by experimental studies. Sprunt and Nur (1976 and 1977) first demonstrated the importance of stress concentration induced by structural heterogeneities in sandstone in reducing porosity, presumably through pressure solution. They compared deformation of two cylindrical samples; one with a cylindrical hole and the other one solid and found faster porosity reduction in the former case. They also deformed a limestone sample under an axial load (Figure 5.1, arrows show loading direction). The shape of the hole was originally circular. Following the deformation, the shape of the hole became approximately elliptical, with the major axis of the ellipse perpendicular to the loading direction. Hickman and Evans (1991; 1995) showed other experimental evidence of time-dependent dissolution under pressure. They pressed a convex halite lens against a flat halite lens in brine for a specific time period. Figure 5.2 shows the reflected sodium light interferograms of the samples. The dark, lobate region in the center of each photo is the contact spot between the two lenses and contains fluid-filled tubes and residual fluid inclusions. The dark concentric bands are interference minima and are partially disrupted by imperfections in the lens surface and through localized mass transfer near the contact spot.

(1) Dissolution and precipitation in an experimentally deformed sample with a cylindrical hole showing the relationship between stress concentration and pressure solution. Solenhofen limestone deformed under axial load (arrows). From Sprunt and Nur 1977. The shape of the hole was originally circular, but following the deformation, it became approximately elliptical, with the major axis of the ellipse perpendicular to the direction of the axial load. (2) Reflected sodium light interferograms shown intergranular pressure solution (IPS) produced experimentally by pressing a convex halite lens against a flat halite lens in brine for the times marked on the images. Dark spots at the center are contact areas and the concentric bands are interference minima disrupted by localized mass transfer at the contacts. From Hickman and Evans (1991). The authors in a later manuscript (Hickman and Evans, 1995) produced contact geometry without significant channel boundary structures (2(A) and 2(B)). Other experiments by the authors also demonstrated the solution rate enhancement by the presence of clay in the boundary film.Figure 5. (1) Dissolution and precipitation in an experimentally deformed sample with a cylindrical hole showing the relationship between stress concentration and pressure solution. Solenhofen limestone deformed under axial load (arrows). From Sprunt and Nur 1977. The shape of the hole was originally circular, but following the deformation, it became approximately elliptical, with the major axis of the ellipse perpendicular to the direction of the axial load. (2) Reflected sodium light interferograms shown intergranular pressure solution (IPS) produced experimentally by pressing a convex halite lens against a flat halite lens in brine for the times marked on the images. Dark spots at the center are contact areas and the concentric bands are interference minima disrupted by localized mass transfer at the contacts. From Hickman and Evans (1991). The authors in a later manuscript (Hickman and Evans, 1995) produced contact geometry without significant channel boundary structures (2(A) and 2(B)). Other experiments by the authors also demonstrated the solution rate enhancement by the presence of clay in the boundary film.

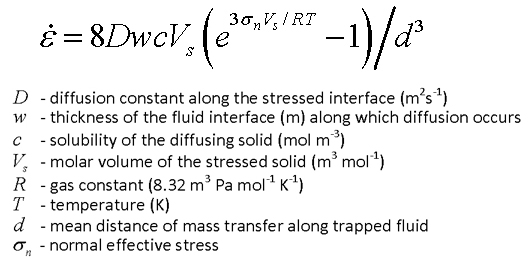
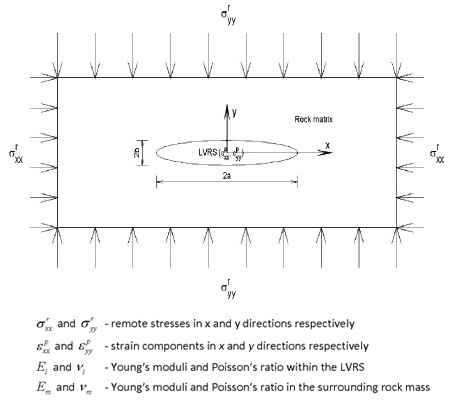
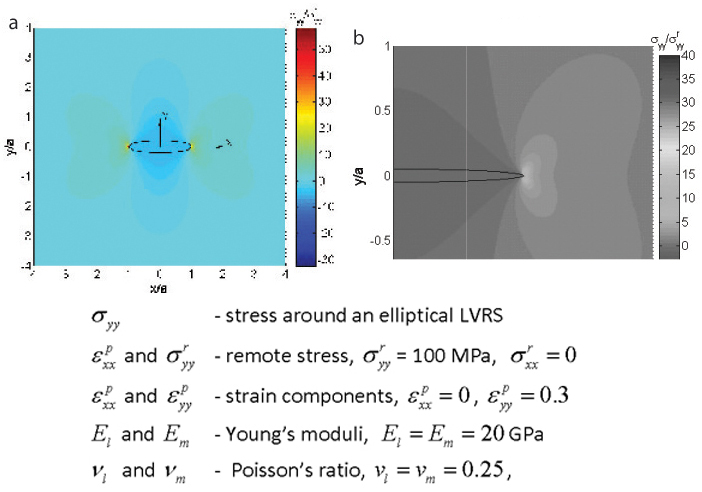
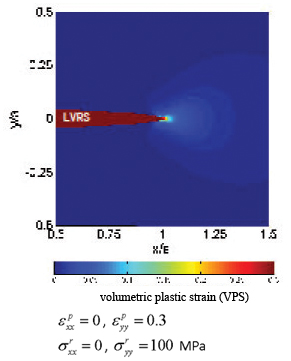
The macro-mechanics of pressure solution was first modeled by Fletcher and Pollard (1981) as an 'anti-crack.' This model was also employed by Sternlof et al. (2005) to investigate compaction bands which are mechanically similar. In these models, pressure solution seams initiate at flaws and propagate in a plane perpendicular to the greatest compression, a behavior that is just opposite to opening-mode cracks or joints. In a recent numerical study, Katsman et al. (2006) modeled pressure solution and similar compactive structures as Localized Volume Reduction Structures (LVRSs) using an Elastoplastic Spring Network model and noted that the stress perturbation around the modeled LVRSs is different than that of an anti-crack model.

Recently, Zhou and Aydin (2010), Nenna and Aydin (2011), and Nenna et al. (2012) have made detailed observations of pressure solution seams in detrital rocks and modeled them as Localized Volume Reduction Structures of Katsman et al. (2006). Figure 6 shows the model configurations in their study for both elastic and creep rheology using the rate-dependent stress-strain rate relationship proposed by Gratier et al. (2009), as shown in Equation 1. Figure 7 shows the stress distribution around an elliptical LVRS using elastic solution ((a) the entire field and (b) details at the tip). Figure 8 shows plastic volumetric strains using the creep law in Eq. (1). There are two major results from these models: first, there are significant concentrations of compressive stress and volumetric plastic strain at the tip areas of the modeled LVRSs; and second, the stress and volumetric plastic strain decrease at the flanks of the LVRS. It is also interesting to point out the influence of the aspect ratio on both stress reduction at the flanks and diminishing concentration of LVRS-normal stress at their tips. This issue will be revisited in the section dealing with length distribution of the pressure solution seams and their scaling.

Experimentally derived creep law in which strain rate is related to stress. From Gratier et al. (2009). Equation 1. Experimentally derived creep law in which strain rate is related to stress. From Gratier et al. (2009).
Model configuration showing an elliptical LVRS subjected to initial plastic compressive strain perpendicular to its long axis and remote biaxial stresses in the x- and y-directions, respectively. The remote stress component in the y-direction is larger in order to be self consistent with the model configuration in which the initial pressure solution seam is assumed to be along the x-axis. Material properties within LVRS and in the surrounding rock are defined below the figure. From Katsman et al. (2006) and Zhou and Aydin (2010).Figure 6. Model configuration showing an elliptical LVRS subjected to initial plastic compressive strain perpendicular to its long axis and remote biaxial stresses in the x- and y-directions, respectively. The remote stress component in the y-direction is larger in order to be self consistent with the model configuration in which the initial pressure solution seam is assumed to be along the x-axis. Material properties within LVRS and in the surrounding rock are defined below the figure. From Katsman et al. (2006) and Zhou and Aydin (2010).
(a) The stress contours normalized by the remote stress around an elliptical LVRS with an aspect ratio of 5 with boundary condition specified in the figure. The compressive normal stress concentrations at the tip area are clearly expressed, while the stresses are uniform within elliptical LVRS. Also notice that stress decreases on the flanks of the LVRS compared to the remote stress. (b) Stress counters around the tip of an elliptical LVRS with an aspect ratio of 20 subjected to the same boundary conditions as that in (a). Zhou and Aydin (2010).Figure 7. (a) The stress contours normalized by the remote stress around an elliptical LVRS with an aspect ratio of 5 with boundary condition specified in the figure. The compressive normal stress concentrations at the tip area are clearly expressed, while the stresses are uniform within elliptical LVRS. Also notice that stress decreases on the flanks of the LVRS compared to the remote stress. (b) Stress counters around the tip of an elliptical LVRS with an aspect ratio of 20 subjected to the same boundary conditions as that in (a). Zhou and Aydin (2010).
The distribution of the volumetric plastic strains around the tip area  of an elliptical LVRS with an aspect ratio of 20 after 1000 years of pressure solution deformation. The normalized Young’s modulus within the LVRS is 2, and the half length is a. From Zhou and Aydin (2010).Figure 8. The distribution of the volumetric plastic strains around the tip area of an elliptical LVRS with an aspect ratio of 20 after 1000 years of pressure solution deformation. The normalized Young’s modulus within the LVRS is 2, and the half length is a. From Zhou and Aydin (2010).

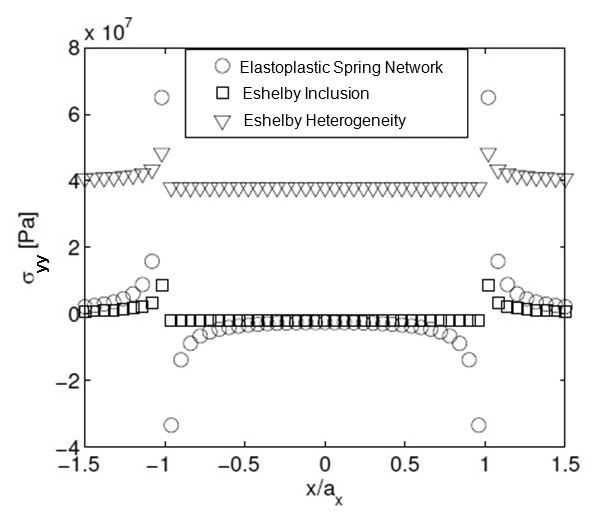
Models based on the Eshelby inclusion or heterogeneity have also been employed to investigate LVRSs (Rudnicki et al., 2006; Meng and Pollard, 2014). Figure 9 is a diagram showing stress component perpendicular to the LVRS or inclusion-heterogeneity for these models. Concentration of the LVRS-normal stress at their tips are common although the tip stress magnitudes differ from each other. The LVRS-normal stress within the models are significantly different for the Eshelby Heterogeneity model due to a drastically different value for the elastic modulus assigned for the material within the model.

Diagram for comparing LVRS-normal stress distribution within and along the in-plane extension outside of LVRSs for Elastoplastic Spring Network of Katsman et al. (2006) and Eshelby Inclusion and Heterogeneity models of Meng and Pollard (2014). Concentration of LVRS-normal stresses are common in both models although tip stress magnitudes are somewhat different. The LVRS-normal stress within the structures vary from one model to another, the greatest variation of which is associated with the Eshelby Heterogeneity model due to the drastically different elastic properties assigned for the material within the LVRS. From Meng and Pollard (2014).Figure 9. Diagram for comparing LVRS-normal stress distribution within and along the in-plane extension outside of LVRSs for Elastoplastic Spring Network of Katsman et al. (2006) and Eshelby Inclusion and Heterogeneity models of Meng and Pollard (2014). Concentration of LVRS-normal stresses are common in both models although tip stress magnitudes are somewhat different. The LVRS-normal stress within the structures vary from one model to another, the greatest variation of which is associated with the Eshelby Heterogeneity model due to the drastically different elastic properties assigned for the material within the LVRS. From Meng and Pollard (2014).
Types of Mechanisms and Mechanics of Pressure Solution Seams:
Initiation of Pressure Solution SeamsPropagation of Pressure Solution SeamsGrowth of Pressure Solution SeamsThickening of Pressure Solution SeamsInteraction of Pressure Solution Seams
Mechanisms and Mechanics of Pressure Solution Seam ZonesMechanisms and Mechanics of Pressure Solution Seam SetMechanisms and Mechanics of Multiple Pressure Solution Seam Sets
Mechanisms and Mechanics of Splay Pressure Solution Seams

Factors Affecting Pressure Solution
Reference:

Dunnington, H.V., 1954. Stylolite development post-dates rock induration. Journal of Sedimentary Petrology 24(1): 27-49.

Engelder, T., 1982. Fossils record the force of continental collision. Lamont-Doherty Geological Observatory of Columbia University Yearbook 1981-1982 8: 37-39.

Fletcher, R.C., Pollard, D.D., 1981. Anticrack model for pressure solution surfaces. Geology 9: 419-424.

Gratier, J.P., Renard, F., Labaume, P., 1999. How pressure solution creep and fracturing processes interact in the upper crust to make it behave in both a brittle and viscous manner. Journal of Structural Geology 21 (8-9): 1189-1197.

Groshong, R.H., Jr, 1988. Low-temperature deformation mechanisms and their interpretation. Geological Society of America Bulletin 100: 1329-2360.

Hickman, S.H., Evans, B., 1991. Experimental pressure solution in halite - the effect of grain interphase boundary structure. Journal of the Geological Society 148: 549 -560.

Hickman, S.H., Evans, B., 1995. Kinetics of pressure solution at halite-silica interfaces and intergranular clay films. Journal of Geophysical Research 100 (B7): 13,113-13,132.

Katsman, R., Aharonov, E., Scher, H., 2006. A numerical study on localized volume reduction in elastic media: Some insights on the mechanics of anticracks. Journal of Geophysical Research 111: B03204, doi:10.1029/2004JB003607.

Meng, C., Pollard, D.D., 2014. Eshelby's solution for ellipsoidal inhomogeneous inclusions with applications to compaction bands. Journal of Structural Geology 67: 1-19.

Nenna, F., Aydin, A., 2011. The formation and growth of pressure solution seams in clastic rocks: A field, analytical and numerical study. Journal of Structural Geology 33: 633-643, doi:10.1016/j.jsg.2011.01.014.

Nenna, F., Zhou, X., Aydin, A., 2012. Spatial statistical properties of pressure solution seams in clastic rocks in southwest Ireland. Mathematical Geosciences 44: 595-617, doi: 10.1007/s11004-012-9407-4.

Renard, F., Dysthe, D.K., 2003. Pressure solution. In Encyclopedia of Sediments and Sedimentary Rocks, edited by G. V. Middleton, Kluwer Academic Publishers.

Rutter, E.H., 1983. Pressure solution in nature, theory and experiment. Journal of Geological Society 140 (Sep): 725-740.

Sorby, H.C., 1879. The structure and origin of limestones. Geological Society of London, Proceedings 35: 56-95..

Sprunt, E.S., Nur, A., 1976. The reduction of porosity by pressure solution: Experimental verification. Geology 4: 463-466.

Sprunt, E.S., Nur, A., 1977. Experimental study of effects of stress on solution rate. Journal of Geophysical Research 82(20): 3013-3022.

Weyl, P., 1959. Pressure solution and the force of crystallization - a phenomenological theory. Journal of Geophysical Research 54 (11): 2001-2025.

Zhou, X., Aydin, A., 2010. Mechanics of pressure solution seam growth and evolution. Journal of Geophysical Research 115: B12207, doi:10.1029/2010JB007614.


Readme    |    About Us    |    Acknowledgement    |    How to Cite    |    Terms of Use    |    Ⓒ Rock Fracture Knowledgebase