|
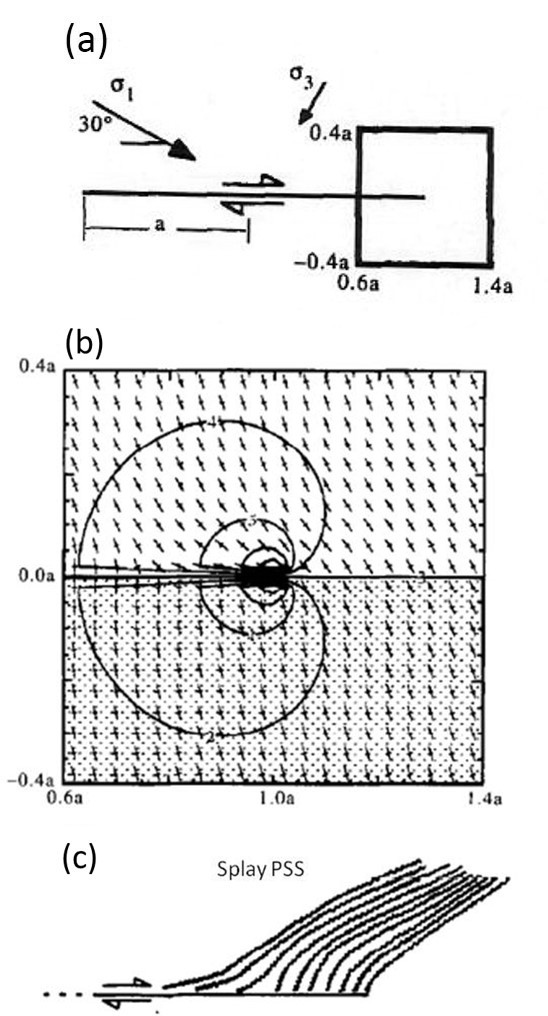
One of the simplest early 2D models is based on the Displacement Discontinuity Boundary Element Model (DDBEM) to map stress distribution around a nearly frictionless fault subjected to remote compressive stresses with a 5/1 ratio (Figure 1a) and then determine stress trajectories along splay pressure solution seams that would form (Figures 1b and 1c). This model was quite successful in reproducing some of the splay pressure solution seam (PSS) patterns observed in the field in the Appalachian fold and thrust belt by Ohlmacher and Aydin (1997).
 | | Figure 1. DDBEM and the resulting stress distributions around a nearly frictionless fault subjected to remote compressive stresses with 5/1 ratio. (a) Model configuration, (b) stress distributions with tick marks, long thick mark in the greatest compression direction. (c) Stress trajectories at the compressive quadrant. From Ohlmacher and Aydin (1997). |
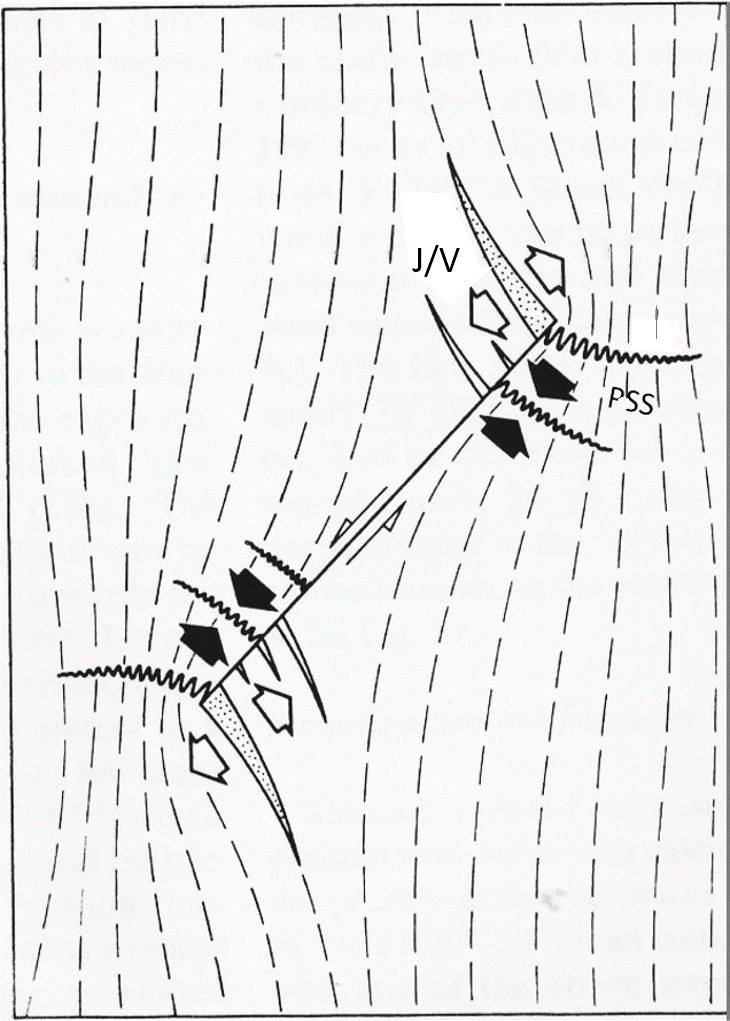
Similar models based on elastic stress trajectories were used by Petit and Mattauer (1994) to rationalize observed splay PSS distributions around faults in southern France (Figure 2).
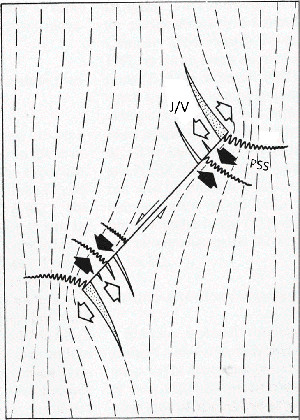 | | Figure 2. Diagram illustrating splay joints/veins (J/V) and pressure solution seams (PSS) based on stress trajectories around a shear fracture with the sense represented by half arrows and full and blank large arrows for the orientation of local compression and tension, respectively. From Petit and Mattauer, 1995. |
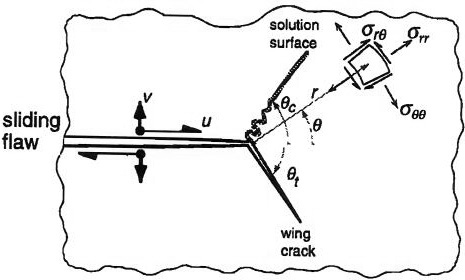
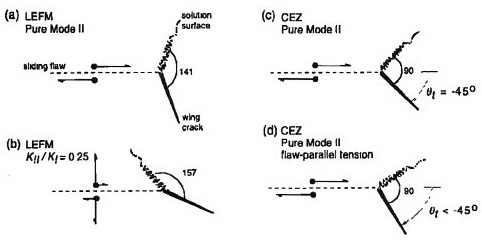
More advanced model studies have also been performed by Willemse and Pollard (1998) using Linear Elastic Fracture Mechanics (LEFM) models as well as more complex material behaviors such as cohesive end zones of various size (Figure 3). Figure 4 is a summary of various orientations of splay PSSs and splay joints or wing cracks as the original authors called them. These models predict highly variable angles (kink angles) between splay pressure solutions and sliding flaws or faults depending on the loading as summarized in Figure 4. The most critical factors are the sign and magnitude of fault normal and fault parallel stress components.
 | | Figure 3. Basic model configuration used by Willemse and Pollard (1998) to analyze splay fracture (referred to as wing crack and solution surface by the original authors). ‘u' and ‘v' shear and normal components of shearing and stress components at a point at a distance ‘r' from the tip. Theta for various angular parameters. |
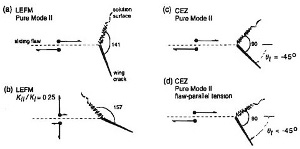 | | Figure 4. Predicted splay PSS and wing crack (join or vein) orientations for LEFM (linear elastic fracture mechanics models) (a- pure mode ll, b- mixed mode) and CEZ (cohessive end zone models) (c- pure mode ll and d- mode ll and flaw parallel tension). From Willemse and Pollard (1998). |
| |
Ohlmacher, G., Aydin, A., 1997. Mechanics of vein, fault and solution surface formation in the Appalachian Valley and Ridge, northeastern Tennesssee, U.S.A: implications for fault friction state of stress and fluid pressure. Journal of Structural Geology 19: 927-944.
Petit, J.P., Mattauer, M., 1995. Palaeostress superimposition deduced from mesoscale structures in limestone: the Matelles exposure, Languedoc, France. Journal of Structural Geology 17 (2): 245-256.
Willemse, E.J.M, Pollard, D.D., 1998. On the orientation and patterns of wing cracks and solution surfaces at the tips of a sliding flaw and fault. Journal of Geophysical Research - Solid Earth 103 (B2): 2427-2438.
|