|
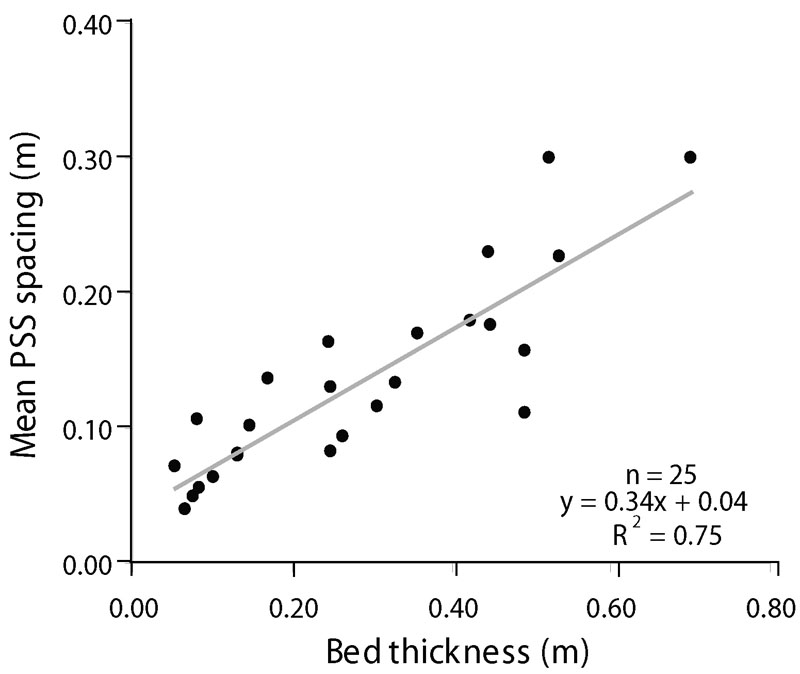
The dependence of joint array spacing on the thickness of beds in which the joints reside is well studied. Considering the anticrack analogy for PSSs, the spacing of PSS arrays may also depend on the bed thickness. To this end, there is not a lot of data. However, one data set available suggests a somewhat linear bed thickness-PSS spacing relationship. Figure 1 shows a plot based on the measurements along scanlines across a pavement of a sandstone outcrop. Although the number of measurements is not large enough to be confident about any generalization of the form of the trend and there is a large spread in the central part of the graph, an increasing spacing with increasing bed thickness for a given strain magnitude may be inferred. However, care is required to extend the spacing-bed thickness trend for joints to PSSs as elaborated below.
 | | Figure 1. Bed thickness versus spacing plot based on measurements along scanlines across a sandstone outcrop pavement. A linear trend of the data points is evident. From Nenna et al. (2012). |
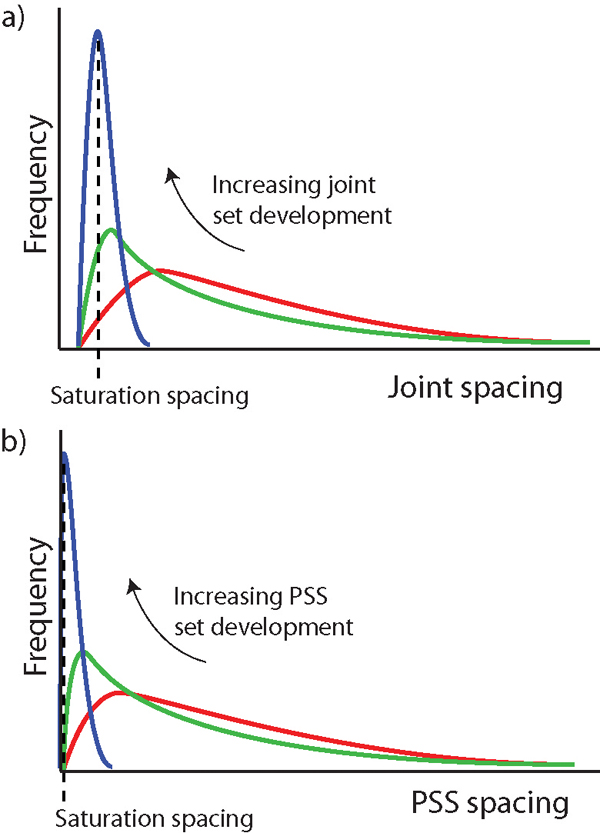
There appears to be some important differences between the evolution of joint spacing and PSS spacing (Nenna et al., 2012). The most important one is that joints have a well-defined spacing saturation, while PSSs do not. The spacing of PSS arrays can be ever decreasing, at least conceptually, in response to large amounts of strain. Figure 2 shows two conceptual diagrams illustrating this difference.
 | | Figure 2. Comparison of conceptual evolution of spacing-bed thickness for joints (a) and for PSSs (b). Red to green to blue show the evolution of spacing for each structure type. The major difference is that joints have a well defined range for saturation state while PSSs do not. From Nenna et al. (2012). |
| |
Nenna, F., Zhou, X., Aydin, A., 2012. Spatial statistical properties of pressure solution seams in clastic rocks in southwest Ireland. Mathematical Geosciences 44: 595-617, doi: 10.1007/s11004-012-9407-4.
|