| |||||||
|
|
|||||||
|
|
|||||||
| Pressure Solution Seam Spacing | |||||||
|
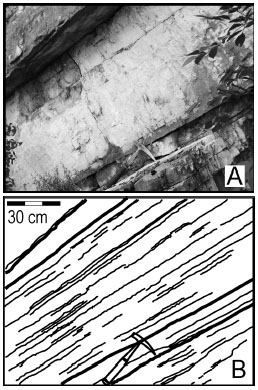
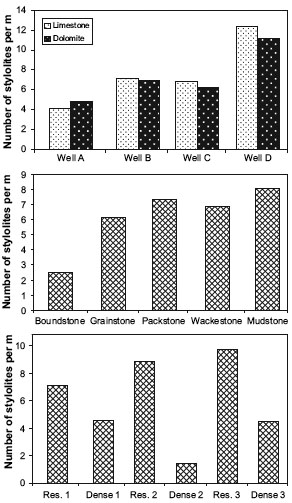
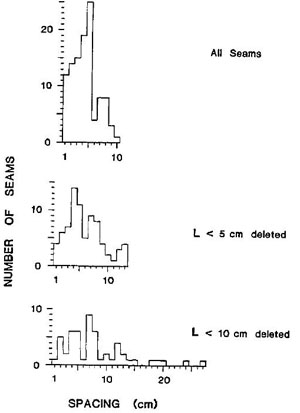
The spacing of pressure solution seams (PSSs) varies from outcrop to outcrop and from one bed to another (Railsback, 1998). This is because, similar to joints, PSS spacing scales with the thickness of the depositional or mechanical beds in which they occur. Before we present data about the scaling properties of PSSs, we summarize below the spacing distributions reported in the literature. Alvarez et al. (1978) reported that the spacing of pressure solution seams in pelagic limestones varies from larger than 5 cm in weakly deformed rocks to less than 0.5 cm in the most intensively deformed rocks. These authors classified all their outcrop data into four intensity categories: 1. Weak intensity with larger than 5 cm spacing and with estimated shortening up to 4%. 2. Moderate intensity with 1 to 5 cm spacing and with estimated shortening from 4 to 25%. 3. Strong intensity with 0.5 to 1 cm spacing and with estimated shortening from 25 to 35%. 4. Very strong intensity with spacing less than 0.5 cm and with shortening larger than 35%. Graham (2001) and Graham et al. (2003) documented spacing ranging from about 0.5 cm to 20 cm in bed-parallel stylolitic pressure solution sets (Figure 1) in platform carbonates, Maiella Mountain, Central Apennines, Italy. Peacock and Azzam (2006) reported average spacing of stylolites (Figure 2) measured from cores in the Khuff Formation of UpperPermian and Lower Triassic age in Abu Dhabi. Though stylolite amplitude varies, spacing in limestones and dolomites is similar (Figure 2 top). Based on the matrix texture of carbonates, higher spacing occurs in boundstones than the finer rocks, though grainstones, packstone, wackestones, and mudstones show similar spacing (Figure 2 middle). Larger spacing tends to occur within the dense zones (Figure 2 bottom), possibly because pressure solution is inhibited by the anhydrite and the related low porosities and permeabilities within the dense zone. Refer to the section 'Factors Effecting Pressure Solution' for related discussion. Figure 3 shows spacing frequency measured on pavements of limestone outcrops exposed in the Appalachians, Pennsylvania, USA (Mardon, 1988). Most spacing values fall under 5 cm.
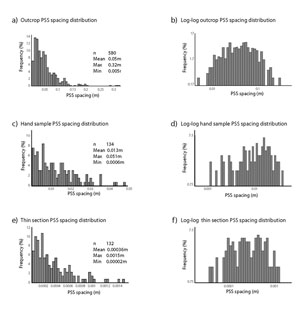
The only data set available from a detrital rock measured using thin sections under optical microscope, polished hand samples, and outcrops from that by Nenna et al. (2012) is presented in Figures 4 (a to f with b, d, and f being log-log plots). The spacing values range from 0. 002 to 24 cm and show a lot more smaller spacing than larger spacing. Again the distributions appear to be hyperbolic in form (see the right hand column in Figure 4). Karcz and Scholz (2003), based on their study of the Calcare Massicco Formation, proposed a fractal geometry of stylolites in the limestone. | |||||||
| Reference: |
|||||||
| Alvarez, W. , Engelder, T., Geiser, P.A., 1978 Graham Wall, B., 2001 Graham Wall, B., Antonellini, M., Aydin, A., 2003 Karcz, K., Scholz, C.H., 2003 Mardon, D., 1988 Nenna, F., Zhou, X., Aydin, A., 2012 Peacock, D.C.P., Azzam, I. N., 2006 Railsback, B.L., 1998 |
|||||||
|
Readme | About Us | Acknowledgement | How to Cite | Terms of Use | Ⓒ Rock Fracture Knowledgebase |
|||||||


