|
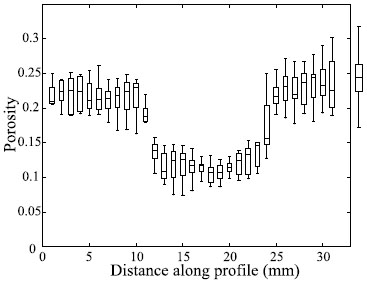
The porosity of compaction bands in Aztec sandstone of Valley of Fire State Park in southeastern Nevada was measured by several investigators. Among them are Sternlof (2006) and Sternlof et al. (2006) who determined porosity profiles across compaction bands using a two-dimensional image analysis technique developed by Keehm et al. (2006). Despite the coarseness inherent to porosity distribution in the parent sandstone, profiles across compaction bands (Figure 1) clearly reveal the abrupt drop in porosity that defines the band. Mean porosity in the sandstone outside the band was measured to be 24.5% with a standard deviation of 2.9%. Mean porosity inside the band was measured to be 11.9%, with a standard deviation of 3.0%, which are consistent with the previous results obtained from comparable band types by Antonellini et al. (1994). Sternlof et al. (2006) using permeability values calculated from the porosity measurements simulated the effect of arrays of compaction bands on fluid flow using a discrete-feature model. They inferred a modest degree of large-scale anisotropy on the pressure effect between the directions along, and perpendicular to the dominant compaction band set.
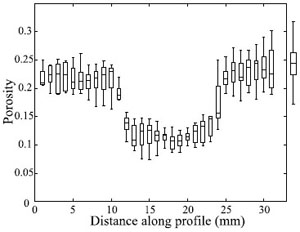 | | Figure 1. Porosity profiles taken orthogonally across the compaction band at the middle of the band length. Each box plot represents a composite of 10 porosity measurements from immediately adjacent transects. The horizontal lines comprising the boxes indicate lower quartile, median and upper quartile values of the group. The whiskers extend up to 1.5 times the interquartile range to indicate the spread of additional data points. A box plot representing the range of background matrix porosity appears to the right of each profile. The compaction band is clearly defined as a sharp, statistically significant drop in porosity. From Sternlof (2006). |
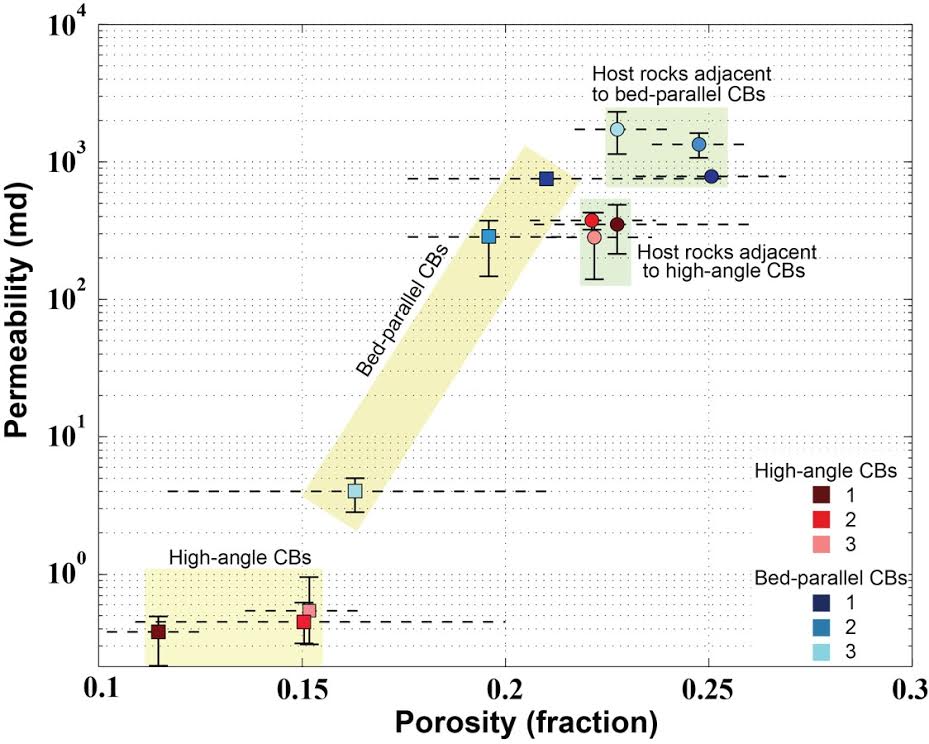
Aydin and Ahmadov (2009) found that a distinct set of compaction bands occurring along the bed interfaces have porosity values comparable to other compaction bands. Deng et al. (2015) carried out laboratory measurements using core flooding technique as well as image-based calculations of a number of compaction bands sampled from the Valley of Fire State Park. Figure 2 shows their results which are plotted in terms of the orientation of compaction band sets with respect to the local cross bed orientation. Table 1 in Figure 3 provides a summary of the compilation by these authors of the host rock and compaction band permeability and porosity values using the data available in the literature. Evidently, there are different values of porosity and permeability values attributed to the compaction bands from the same locality. See Deng et al. (2015) for a detailed discussion of the issues related to different methods of study and Torabi and Fossen (2009) for spatial variation of microstructure and porosity and permeability along deformation bands.
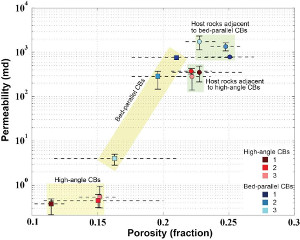 | | Figure 2. Porosity and permeability of compaction bands in the Aztec sandstone in Valley of Fire State Park, southeastern Nevada, which were measured in the laboratory using core flooding technique as well as image analyses. The results are classified by the orientation of the compaction band sets with respect to cross bed orientation. The host rock values are also included. It is clear that the porosity and permeability values are different for each type of compaction band set. From Deng et al. (2015). |
 | | Figure 3. Table summarizing compaction band permeability and porosity reported by a number of authors, with references in the original compilation by Deng et al. (2015). Although the methodology and samples may have been different in these studies, the trend in the reduction of permeability and porosity in the compaction bands with respect to those of the host rock in which they occur is evident. See the original publication for a more detailed discussion of the quantitative differences between some results from the same locality and related issues. |
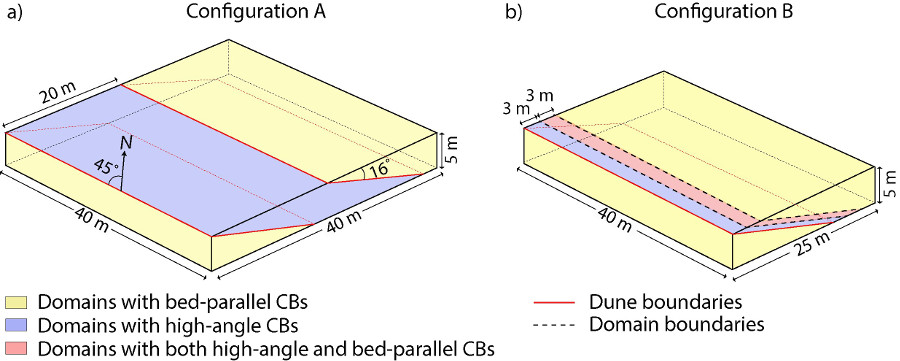
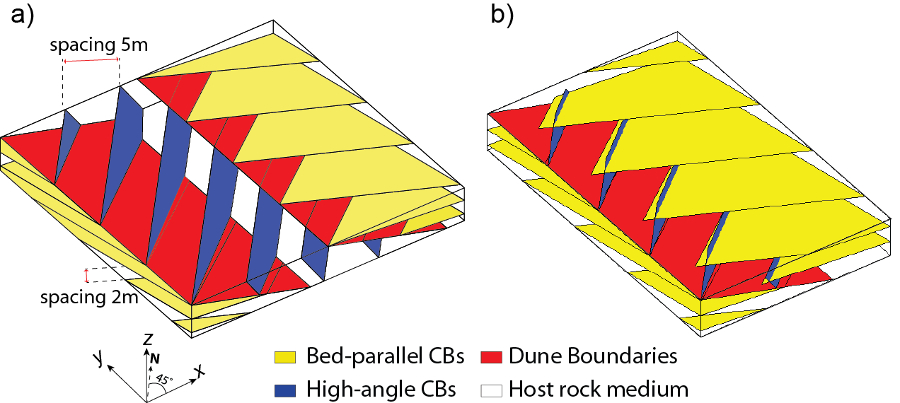
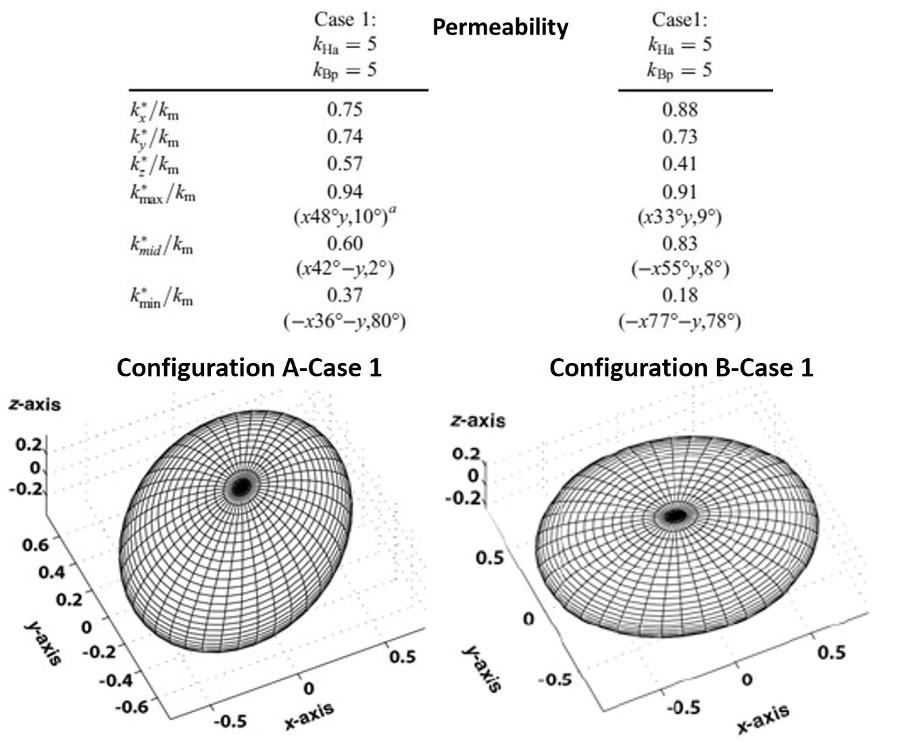
The impact of the distribution of compaction band sets along the cross beds as well as at high-angle to the cross beds (referred to earlier as compaction band domains) on the fluid flow has recently been analyzed by Deng et al. (2016). Figures 4 and 5 show the idealized dune and flow model configurations from these authors. Figure 6 includes representative permeability values of the host rock and compaction bands in a table and their orientation on the top of the illustration as well as the calculated 3D upscaled permeability for two simple cases for the configurations (A) and (B). A simple comparison of the results from these representative configurations suggests that distribution of the dunes and compaction band domains therein may have a significant impact on the fluid flow across the dune packages.
|
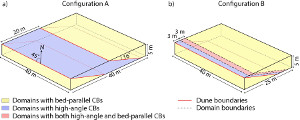 | | Figure 4. Idealized configurations of dunes with compaction band domains in different colors: yellow for bed-parallel compaction band domains blue for high-angle to bed band domains. the average dimensions and orientations based on the field observations are as marked. Configuration A in (a) includes single sets whereas Configuration B in (b) includes one domain with both high-angle and bed-parallel compaction bands as well as domains with only one set. From Deng et al. (2016). |
|
 | | Figure 5. Geometric model configuration for flow simulation. (a) For the geological model in Configuration A and (b) for Configuration B. The average spacings of 5 and 2 meters for the high-angle to bedding compaction bands in blue and bed-parallel compaction bands in yellow, respectively. Dune boundaries are in red. The Cartesian coordinates and the direction of the Geographic North are also marked. From Deng et al. (2016). |
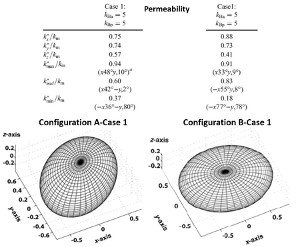 | | Figure 6. On the top is a table listing permeability values for one case (Case 1) in which permeability values used for single compaction bands in both sets are the same (5 mD) . The graphs on the bottom show upscaled permeability tensors normalized by the matrix permeability represented by a 3D ellipsoid for Configuration A (on the left side), and Configuration B (on the right side). The vertex of the mesh denotes the intersection between the minor axis (the minimum permeability component) and the surface of the ellipsoid. See the original paper for other cases in which the bands at different orientation have different permeability values. From Deng et al. (2016). |
| |
Antonellini, M., Aydin, A., Pollard, D.D., D'Onfro, P.S., 1994. Petrophysical study of faults in sandstones using petrographic Image Analysis and X-ray Computerized Tomography. Pure and Applied Geophysics 143: 181-201.
Deng, S., Zuo, L., Aydin, A., Dvorkin, J., Mukerji, T., 2015. Permeability characterization of natural compaction bands using core flooding experiments and 3D image-based analysis: Comparing and contrasting the results from two different methods. American Association of Petroleum Geologists Bulletin 99: 27-49, DOI: 10.1306/07071413211.
Deng, S., Jiang, R., Karimi-Fard, M., Aydin, A., 2016. Fluid-flow effects of compartmentalized distribution of compaction bands in an aeolian sandstone in three dimensions. Petroleum Geosciences, doi: 10.1144/petgeo2016-051.
Keehm, K., Sternlof, K.R., Mukerji, T., 2006. Computational estimation of compaction band permeability in sandstone. Geosciences Journal 10 (4): 499 - 505.
Sternlof, K.R., Karimi-Fard, M., Pollard, D.D., Durlofsky, L.J., 2006. Flow and transport effects of compaction bands in sandstone at scales relevant to aquifer and reservior management. Water Resource Research 42: W07425, doi: 10.1029/2005WR004664.
Sternlof, K.R., 2006. Structural geology, propagation mechanics and hydraulic effects of compaction bands in sandstone. Ph.D. Dissertation, Stanford University.
Torabi, A., Fossen, H., 2009. Spatial variation of microstructure and petrophysical properties along deformation bands in reservoir sandstones. American Association of Petroleum Geologists Bulletin 93: 919–938.
|