Rock Fracture
KNOWLEDGEBASE
  

Porosity and Permeability of Shear Bands

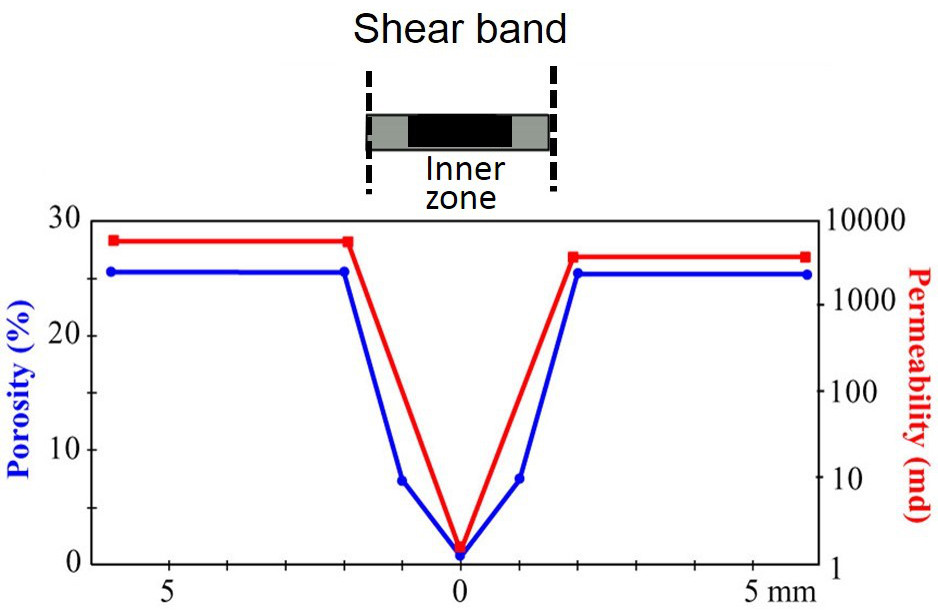
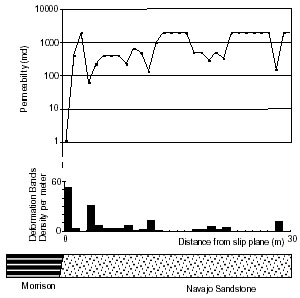
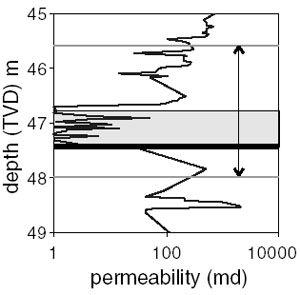
A wide range of shear band permeability values is reported in the literature. Antonellini and Aydin (1994) studied permeability of shear bands from the Entrada and Navajo sandstones at the Arches national Park, southeastern Utah by using mini-permeameter and image analysis technique. They reported that the shear bands that they studied have on average a permeability three orders of magnitude less than those of the surrounding host rock. However, the permeability distribution across a simple shear band is not uniform (Figure 1). Furthermore, they determined that the permeability across a thin zone adjacent to a slip surfaces associated with shear band zones is several order of magnitudes lower than that of the host rock (Figure 2). Also see Aydin et al. (2006) for a perspective of a broader class, deformation band permeability and porosity.

Permeability and porosity profile across a single deformation band in the Moab member of the Entrada Sandstone at Delicate Arch View point, Arches National Park, Utah. By Antonellini and Aydin (1994).Figure 1. Permeability and porosity profile across a single deformation band in the Moab member of the Entrada Sandstone at Delicate Arch View point, Arches National Park, Utah. By Antonellini and Aydin (1994).
Number of deformation bands per meter and relative permeability profile across a fault zone with larger than 150 m slip in the Navajo Sandstone, east of the Delicate Arch. By Antonellini and Aydin (1994).Figure 2. Number of deformation bands per meter and relative permeability profile across a fault zone with larger than 150 m slip in the Navajo Sandstone, east of the Delicate Arch. By Antonellini and Aydin (1994).

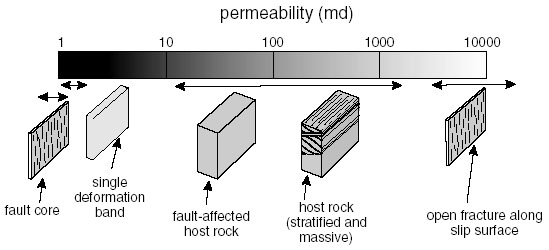
Shipton et al. (2002) measured permeability of deformation bands and deformation band-based faults with slip surfaces (nomenclature is the same as the original authors) from drill cores extracted from the Navajo sandstone in the San Rafael Swell, Utah, using a probe permeameter. They identified four types of structures at and around the fault cores with different representative permeability values as shown in Figure 3.

Synoptic diagram of fault-zone elements and the relative permeability values of each element for the Big Hole fault, a normal fault with about 8 meters slip. From Shipton et al. (2002).Figure 3. Synoptic diagram of fault-zone elements and the relative permeability values of each element for the Big Hole fault, a normal fault with about 8 meters slip. From Shipton et al. (2002).

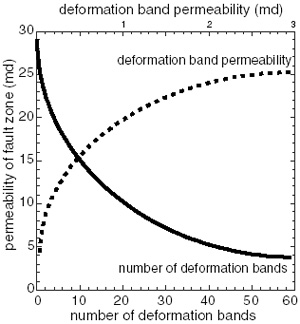
The fault core consists of closely spaced individual shear bands and represents the highest permeability reduction. Permeability values decline from 1000 md of host rocks to around 1 md near the fault core or near the shear band cluster. Outside of the fault zone, permeability returns to the background values in the range of 100 to 1000 mD. The calculated bulk permeability values over length scales of 5 to 10 m are 30 to 40 mD. These authors using the Transmissibility Multiplier method developed by Manzocchi et al. (1999) determined upscale permeability of shear band zones and suggested that the upscaled permeability values depend on the the number of the bands (Figure 4), their spacing, and the thickness of the fault zone (Figure 4, Figure 5 and Figure 6).

Upscaled fault-normal permeability as a function of deformation band permeability (dotted line) or deformation band density (solid line). Increasing the number of deformation bands or decreasing the permeability of individual deformation bands reduces the upscaled fault permeability. From Shipton et al. (2002).Figure 4. Upscaled fault-normal permeability as a function of deformation band permeability (dotted line) or deformation band density (solid line). Increasing the number of deformation bands or decreasing the permeability of individual deformation bands reduces the upscaled fault permeability. From Shipton et al. (2002).
Calculated upscaled fault-normal permeability as a function of fault core thickness. From Shipton et al. (2002).Figure 5. Calculated upscaled fault-normal permeability as a function of fault core thickness. From Shipton et al. (2002).
Probe permeameter data at 3 cm spacing near the Big Hole fault zone, Utah. The fault zone (tightly packed deformation bands adjacent to the main slip surface) is marked by gray box. The top and base of the fault core cluster are marked by gray lines and arrows. From Shipton et al (2002).Figure 6. Probe permeameter data at 3 cm spacing near the Big Hole fault zone, Utah. The fault zone (tightly packed deformation bands adjacent to the main slip surface) is marked by gray box. The top and base of the fault core cluster are marked by gray lines and arrows. From Shipton et al (2002).

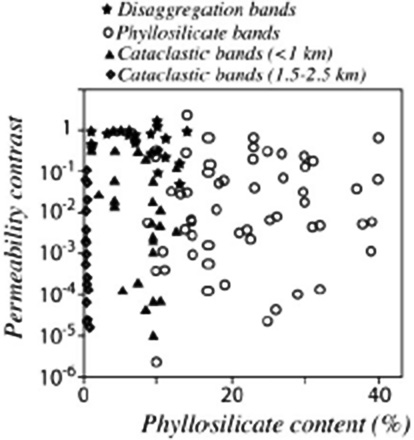
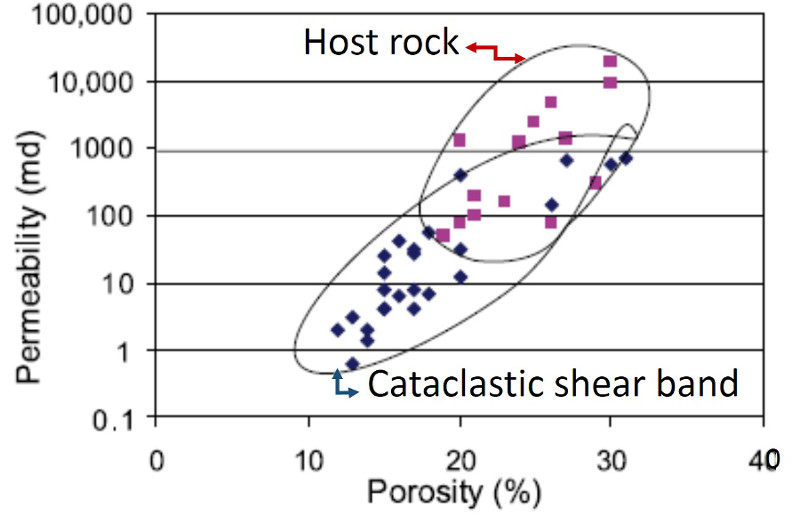
Fossen et al. (2007) linked the variation of shear band permeability values in part to the specific lithology of sandstones and the formation mechanisms and architecture of shear bands (Figure 7). The values in their plot are particularly sensitive to the clay content of the host rock (phyllosilicate in the plot) and to the mechanism of deformation, particularly cataclastic deformation and disaggregation in their nomenclature. In a different study, Torabi and Fossen (2009) verified this result and concluded that cataclastic shear band permeability is lower than that of the host rock for the same porosity (Figure 8), but the wide range of variation reported in the literature is probably due to lateral variation of petrophysical properties (presumably both the bands and host rocks).

Relationship among deformation band types and phyllosilicate content and permeability contrast between the bands and the host rocks. From Fossen et al. (2007).Figure 7. Relationship among deformation band types and phyllosilicate content and permeability contrast between the bands and the host rocks. From Fossen et al. (2007).
Permeability-porosity relationship for cataclastic shear bands and their host rock. The authors concluded that the  shear band permeability is lower for the same host rock porosity. From Torabi and Fossen (2009).Figure 8. Permeability-porosity relationship for cataclastic shear bands and their host rock. The authors concluded that the shear band permeability is lower for the same host rock porosity. From Torabi and Fossen (2009).

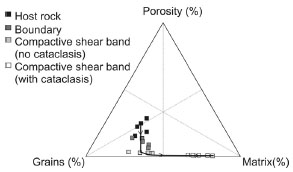
Tondi et al (2005, 2006) using CT scan determined porosity decrease from about 20% in the host rock to about 5% or less in the shear bands (Figure 9) in carbonate grainstone. These results indicate that the porosity and permeability reduction of comparable magnitude may occur in shear bands in a different lithology aside from sandstone.

Percentage of pores, grains, and matrix of deformation bands. Line with arrows depicts the deformation path. From Tondi et al. (2005).Figure 9. Percentage of pores, grains, and matrix of deformation bands. Line with arrows depicts the deformation path. From Tondi et al. (2005).
Reference:

Antonellini, M., Aydin, A., 1994. Effect of faulting on fluid flow in porous Sandstones: petrophysical properties. American Association of Petroleum Geologists Bulletin 78 (3): 355-377.

Aydin, A., Borja, R., Eichhubl, P., 2006. Geological and mathematical framework for failure modes in granular rock. Journal of Structural Geology 28 (1): 83-98.

Fossen, H., Schultz, R.A., Shipton, Z.K., Mair, K., 2007. Deformation bands in sandstone: a review. Journal of the Geological Society 164: 755-769.

Manzocchi, T., Walsh, J.J., Nell, P., Yielding, G., 1999. Fault Transmissibility Multipliers for Flow Simulation Models. Petroleum Geoscience 5: 53-63.

Shipton, Z.K., Evans, J.P., Robeson, K.R., Forster, C.B., Snelgrove, S., 2002. Structural heterogeneity and permeability in faulted eolian sandstone: Implications for subsurface modeling of faults. AAPG Bulletin 86(5): 863-883.

Tondi, E., Antonellini, M., Aydin, A., Marchegiani, L., Cello, G., 2005. The role of deformation bands and stylolites in fault development in carbonate grainstones of Majella Mountain, Italy. Stanford Digital Repository. Available at: http://purl.stanford.edu/nk352yh5434.

Tondi, E., Antonellini, M., Aydin, A., Marchegiani, L., Cello, G., 2006. The role of deformation bands, stylolites and sheared stylolites in fault development in carbonate grainstones of Majella Mountain, Italy. Journal of Structural Geology 28 (3): 376-391.


Readme    |    About Us    |    Acknowledgement    |    How to Cite    |    Terms of Use    |    Ⓒ Rock Fracture Knowledgebase