| |||||||
|
|
|||||||
|
|
|||||||
| Pressure Solution Seam Thickness Distribution | |||||||
|
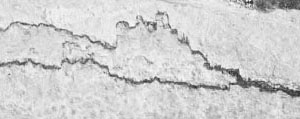
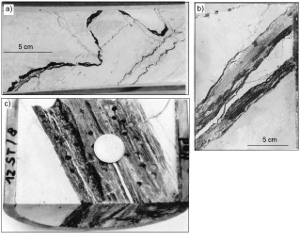
The thickness of pressure solution seams seen by the naked eye on rock surfaces typically ranges from a fraction of a millimeter to a few centimeters (Figure 1 and Figure 2). However, large thicknesses as much as several decimeters as seen in Figure 3(c) were also reported (30 cm mentioned by Safaricz and Davison, 2005).
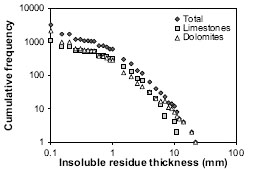
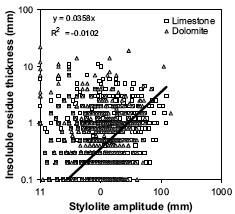
Thicknesses of single isolated seams vary with their shape and along their trace. For seams with a sinusoidal shape, thicknesses tend to be larger at the flat part on the top and bottom than at the inclined part. For stylolites with sutured geometry, the segments are very thin along the sides of the columns or teeth or the residue totally vanishes there. Along the trace of continuous seams, larger amplitude and thicker residue is generally observed at its central part compared to its tips. For example, the ends of the stylolites in Figure 1 are barely noticeable thin lines. For multiple stylolites merging into a zone, the thickness and amplitude of the individual stylolites prior to the merging generally add up to a comparable value to that of the zone (Figures 1, 2, and 3), indicating the same amount of material removed along both cases. The combined thickness of the two branching seams is roughly equivalent to that of the zone of the seam. These observations indicate that thickness of residue varies directly with the amount of dissolved material removed, with the amplitude of the columns, and is inversely proportional with the purity of the host rock as originally proposed by Stockdale (1922). Although the thickness of the residue provides an estimate of the dissolved rock volume, this relationship is not always reliable due to uncertainty in the original rock composition. For example, concentration of clay on or near bedding planes, which enhances the tendency of dissolution there may not be accounted for in the average rock composition determined from other parts of the unit. Peacock and Azzam (2006) reported that stylolite residue thickness in limestone and dolomite obeys a power-law scaling relationship over 1 mm to 10 mm range (Figure 4). However, the relationship between residue thickness and stylolite amplitude in their data set (Figure 5) is rather weak. | |||||||
| Reference: |
|||||||
| Peacock, D.C.P., Azzam, I. N., 2006 Safaricz, M., Davison, I., 2005 Stockdale, P.B., 1922 |
|||||||
|
Readme | About Us | Acknowledgement | How to Cite | Terms of Use | Ⓒ Rock Fracture Knowledgebase |
|||||||


