| |||||||
|
|
|||||||
|
|
|||||||
| Shear Band Length | |||||||
|
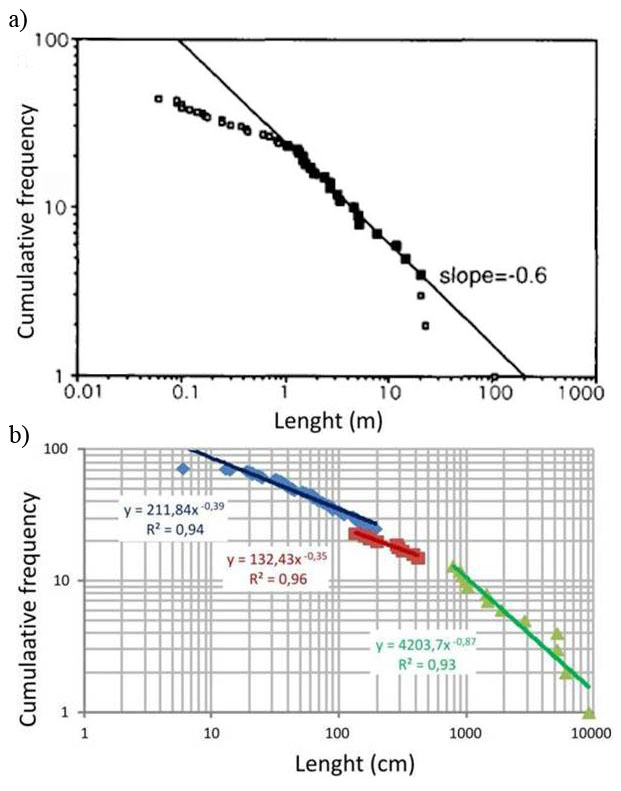
Earlier studies of deformation bands in the Jurassic Entrada and Navajo sandstones exposed in the San Rafael Desert and Arches National Park, both in Utah, included primarily shear bands. It was reported that the lengths of individual bands are commonly on the order of tens of meters with a maximum of a few hundreds of meters (Aydin, 1978). In retrospect, these estimates represented some composite shear bands and shear band zones made up of a few individual bands. In other words, the measured structures may have included linked single shear bands. Studies in the late 1990s, for example, Fossen and Hesthammer (1997) at the San Rafael Desert, reported the largest lengths slightly above 100 meters (Figure 1a). These authors have also proposed that the logarithmic plot of length versus cumulative frequency is linear (except the under sampled ends) suggesting a power-law distribution form. Tondi et al. (2012) have recently compiled a set of data from compactive shear bands in carbonate grainstone in the island of Favignana, west of Sicily, which were divided into single bands, zones of bands, and zones with slip surfaces and fault rocks, all showing linear trends in log-log plots but with differing slopes (Figure 1b). Among these, well-developed mature faults are the longest, which is consistent with the other displacement-fault length relationships in the literature. Poliakov and Herrmann (1994) and Poliakov et al. (1994) proposed that shear bands form fractal networks with a power-law length distribution of the bands characterized with an exponent of 2.07.
| |||||||
| Reference: |
|||||||
| Aydin, A., 1978 Deng, S., Aydin, A., 2012 Fossen, H., Hesthammer, J., 1997 Poliakov, A., Herrmann, H.J., 1994 Poliakov, A., Herrmann, H.J., Podladchikov, Yu Y., Roux S., 1994 Tondi, E., Cilona, A., Agosta, F., Aydin, A., Rustichelli, A., Renda, P., Giunta, G., 2012 |
|||||||
|
Readme | About Us | Acknowledgement | How to Cite | Terms of Use | Ⓒ Rock Fracture Knowledgebase |
|||||||