| Rock Fracture KNOWLEDGEBASE |
Fossen and Hesthammer (1998) discussed the scaling relationship between length and displacement of shear bands from a data set spans more than three orders of magnitude for fault length (0.05 - 100 m) and more than two orders of magnitude for displacement (0.2 - 33 mm) collected from porous Jurassic sandstones, San Rafael desert, Utah.
The data set of shear band shows a relatively well-defined power-law relation between displacement and length (Figure 1). However, the exponent is close to 0.5, in contrast to close to 1 for weakness-based faults, as seen in shear band-based faults with slip surfaces and other faults data by other authors. The jump in scaling relationship between the shear bands and weakness-based faults is believed by the authors to correspond to the development of slip surfaces, after formation of about 10 to 20 cm wide cluster zones with aggregate displacement up to a few tens of centimeters in the study area.
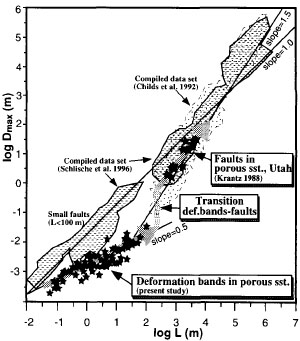 | Figure 1. Maximum displacement vs length for shear bands and faults in porous Jurassic sandstone, San Rafael Desert, Utah (stars). Plotted together are fault data from other sources. Arrows outline a path which shows a break and a vertical shift at the transition from shear band zones to faults with slip surfaces. From Fossen and Hesthammer (1997). |
The lower exponent means that longer deformation bands have relative smaller displacements, when comparing with weakness-based fault with the same length. For example, a weakness-based small fault with 1 cm displacement can be predicted to have a length of 0.5 m, while a shear band with the same displacement should be 10 to 15 m long (Figure 1). Moreover, the difference increases with size: a fault and a shear band with displacement of 5 cm can be predicted to have lengths of about 2 m and 600 m, respectively. This difference may indeed have dramatic effects on modelling of sub-surface structures. While weakness-based faults with a few centimeters offset can be neglected, shear bands with centimeter offset should not because they are likely to be several hundreds meters long.
Copyright Rock Fracture Knowledgebase 2017 | Term of Use | Acknowledgement | Readme