Rock Fracture
KNOWLEDGEBASE
  

Porosity and Permeability of Shale and Smeared Shale

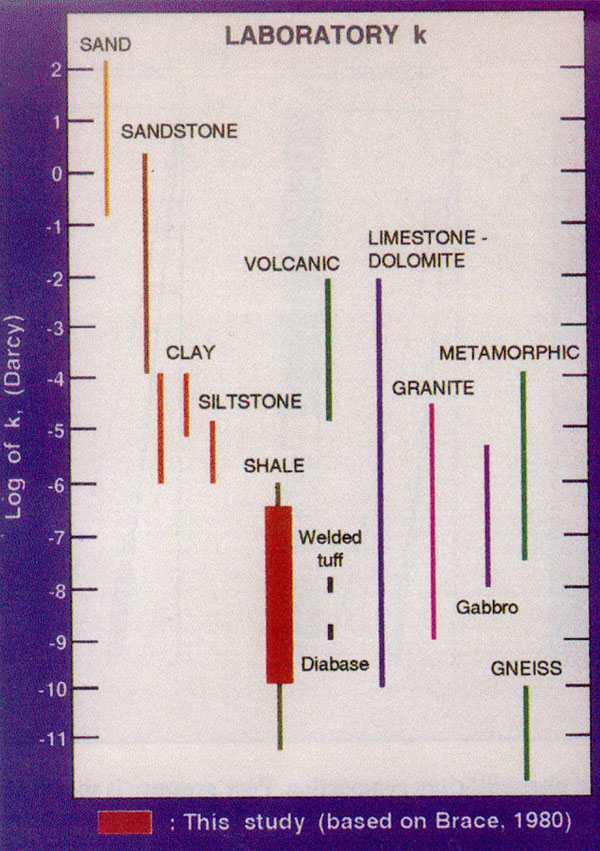
The permeability of shale is among the lowest for various rock types (Figure 1). It has been reported (Best and Katsube, 1995) that tight shales from a depth of 2 to 6 km have permeabilities of 0.1 to 300 nanodarcies. They are 6 to 12 orders of magnitude lower than those for sandstone.

Laboratory measurement of permeaiblities of rocks. From Best and Katsube (1995).Figure 1. Laboratory measurement of permeaiblities of rocks. From Best and Katsube (1995).

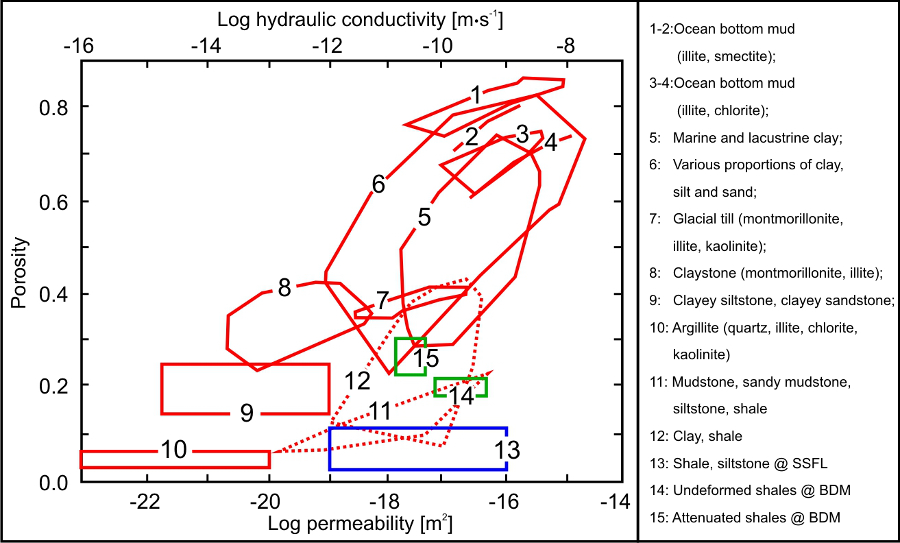
However, what are identified as shales may show wide properties. Figure 2 shows a wide variation in conductivity of shales from various environments (Nuezil, 1994). Smeared shales (Numbers 13, 14, and 15) are even tighter in the direction perpendicular to the direction of shearing because of realignment of platy minerals and development of planar fabric. When shale is entrained into fault zones and hence attenuated and smeared, the fault-normal permeability may be significantly reduced with respect to the permeability of undeformed shale.

Plot of laboratory-derived permeability versus porosity for a variety of natural argillaceous rocks (Neuzil 1994). Fields (outlined in red) denote the range of result values determined for each clay-rich rock type listed in the legend. Permeability is shown along the lower horizontal scale: the corresponding hydraulic conductivity to water at room temperature is shown along the upper horizontal scale. Numbers for each field correspond to lithologies stated in the legend. Fields 1 to 4: bottom deposits from North Pacific; 5: Pleistocene to recent from Quebec, Mississippi Delta and Sweden; 6 from Gulf of Mexico; 7: Southerland Group from Saskatchewan; 8 Pierre Shale from South Dakota; 9 from western Canada; 10: Elena Formation from Nevada; 11 from Japan and Alberta, Canada; 12: Upper Triassic, Mid-Miocene, Lower Pleistocene from Italy; 13 and 14 from Domengine Formation of middle Eocene at the Black Diamond Mine in northern California (Eichhubl et al. 2005); and, 15 from shale and siltstone members of the Upper Cretaceous Chatsworth Formation entrained into a fault in southern California (Cilona et al., 2014).Figure 2. Plot of laboratory-derived permeability versus porosity for a variety of natural argillaceous rocks (Neuzil 1994). Fields (outlined in red) denote the range of result values determined for each clay-rich rock type listed in the legend. Permeability is shown along the lower horizontal scale: the corresponding hydraulic conductivity to water at room temperature is shown along the upper horizontal scale. Numbers for each field correspond to lithologies stated in the legend. Fields 1 to 4: bottom deposits from North Pacific; 5: Pleistocene to recent from Quebec, Mississippi Delta and Sweden; 6 from Gulf of Mexico; 7: Southerland Group from Saskatchewan; 8 Pierre Shale from South Dakota; 9 from western Canada; 10: Elena Formation from Nevada; 11 from Japan and Alberta, Canada; 12: Upper Triassic, Mid-Miocene, Lower Pleistocene from Italy; 13 and 14 from Domengine Formation of middle Eocene at the Black Diamond Mine in northern California (Eichhubl et al. 2005); and, 15 from shale and siltstone members of the Upper Cretaceous Chatsworth Formation entrained into a fault in southern California (Cilona et al., 2014).

The Shale Gouge Ration (SGR, Yielding, 1997) has been used empirically to estimate the sealing or no-sealing of a fault with shale smear. A fault with shale smear is considered sealing when the vertical component of the fault slip exceeds the thickness of the shale layer, until when the shale gouge ratio dropped below a threshold between 25% and 15%. Physically-based evaluation of shale smear potential can be made by identifying major fault segments on the seismic profile and mapping smeared shale on a juxtaposition diagram (Koledoye, 2003).

Reference:

Best, M.E., Katsube, T.J., 1995. Shale permeability and its significance in hydrocarbon exploration. The Leading Edge 14: 165-170.

Koledoye, B., Aydin, A., May, E., 2003. A new process-based methodology for analysis of shale smear along normal faults in the Niger Delta. American Association of Petroleum Geologists Bulletin 87 (3): 445 - 463.

Yielding, G., Freeman, B., Needham, T., 1997. Quantitative fault seal prediction. American Association of Petroleum Geologists Bulletin 81, 897– 917.


Readme    |    About Us    |    Acknowledgement    |    How to Cite    |    Terms of Use    |    Ⓒ Rock Fracture Knowledgebase