| ||||||||||||
|
|
||||||||||||
|
|
||||||||||||
| Slip Distribution along Shear Bands | ||||||||||||
|
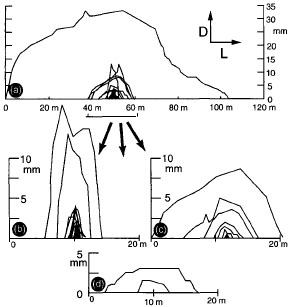
Fossen and Hesthammer (1997) reported displacement or slip profiles along shear bands in the Jurassic Entrada sandstone of San Raffael Desert, Utah. The shear bands are exposed on a 100 * 200 meter sub-horizontal surface, with length ranging from 0.05 to 100 m and displacement ranging from 0.2 to 33 mm. The displacement profiles of shear bands in this study show many similarities with weakness-based faults. For bands consisting of a single segment, almost all displacement profiles (Figure 1) exhibit upward-convex shape. No obvious difference in displacement profile is seen between short and long deformation bands. The displacement maximum may be located in the central portion of the bands, although in many cases the maximum is clearly off-center. Most of the displacement profiles show a clearly defined peak, and only a few show a central plateau of more or less constant displacement.
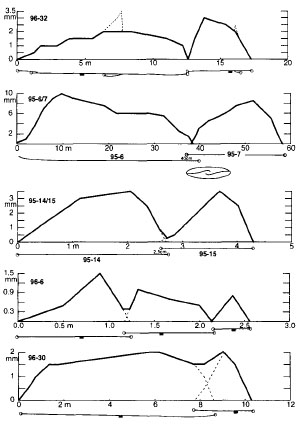
For shear band zones composed of multiple sub-parallel en echelon segments, Fossen and Hesthammer distinguished two types: soft-linked, where segments are not in physical contact, and hard-linked, where segments touch. The two types differ in the way strain is transferred, ductilly across soft-linked zones and brittlely across hard-linked zones. For soft-linked zones, segments developed individually until a degree of overlap, resulting in a combined system. The displacement profiles (examples in Figure 2) corresponding to this process develop from a multipeak type, through a plateau type, and will eventually be a coherent single peak type. At the soft-linked stage, the majority of the profiles show steeper gradient towards the tip in the overlap zone than towards the independent tip, similar to what is described for weakness-based faults.
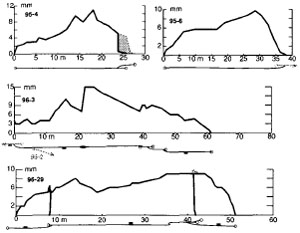
The schematic development of a displacement profile along a hard-lined shear band zone is similar to that of a soft-linked zone, from multipeak-type, followed by plateau-type, to single peak profile if growth pursues without further linkage. Figure 3 shows some example profiles of hard-linked zones.
| ||||||||||||
| Reference: |
||||||||||||
| Fossen, H., Hesthammer, J., 1997 |
||||||||||||
|
Readme | About Us | Acknowledgement | How to Cite | Terms of Use | Ⓒ Rock Fracture Knowledgebase |
||||||||||||