Rock Fracture
KNOWLEDGEBASE
  

Surface Morphology of Faults

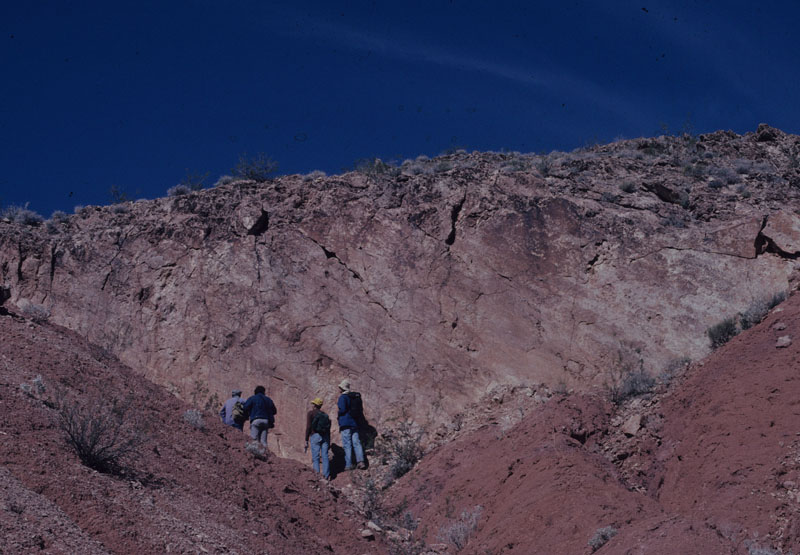
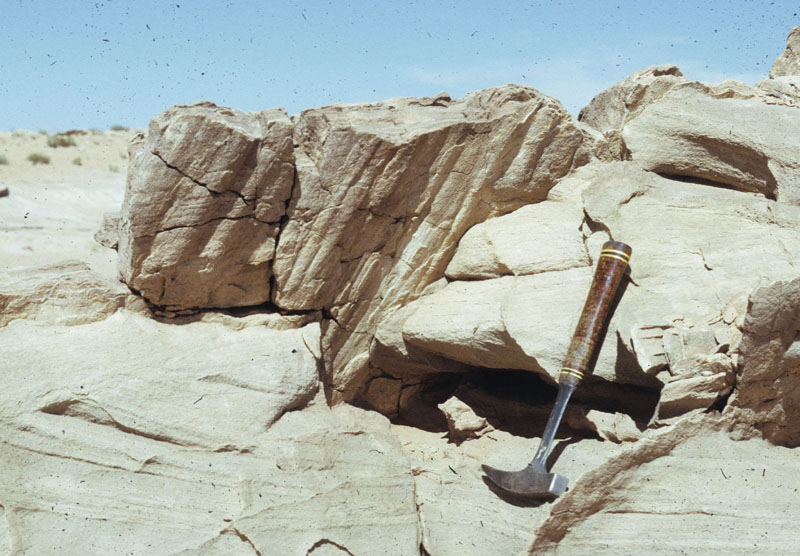
Striations are the ridge-and-grooves or lines inscribed on the surface of a rock, produced by a geological process such as faulting, mass movement, and glacial flow. The striations usually occur in an array of roughly parallel lines (Figure 1 and Figure 2) in the slip direction. However, it is possible that slip direction on a given fault may vary spatially and temporarily resulting small or drastic variations in the orientation of striations across the surface and sometimes in overlapping striation patterns.

A fault surface with highly oblique striations. Echo Hills, Lake Mead National Recreation Park, NV. From Campagna and Aydin (1991).Figure 1. A fault surface with highly oblique striations. Echo Hills, Lake Mead National Recreation Park, NV. From Campagna and Aydin (1991).
Striations on a slip surface at the edge of shear band zone in sandstone, San Rafael Desert, UT. The grows on the surface are highly accentuated. From Aydin and Johnson (1978).Figure 2. Striations on a slip surface at the edge of shear band zone in sandstone, San Rafael Desert, UT. The grows on the surface are highly accentuated. From Aydin and Johnson (1978).

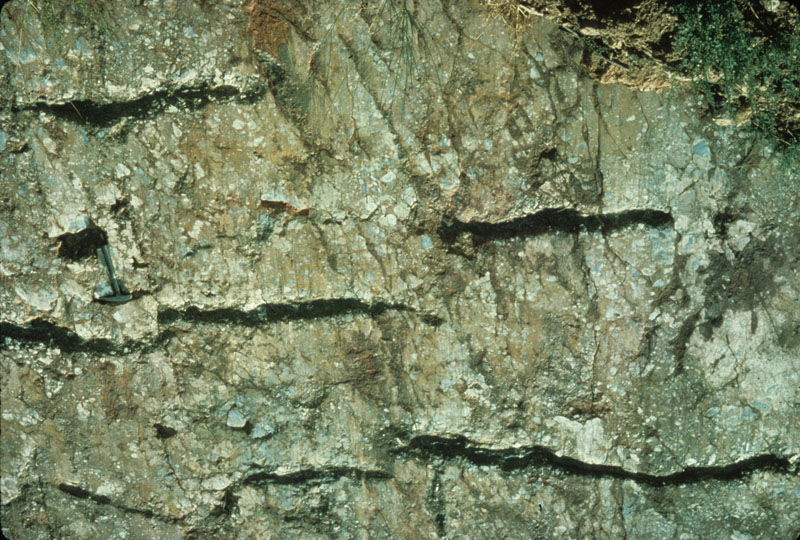
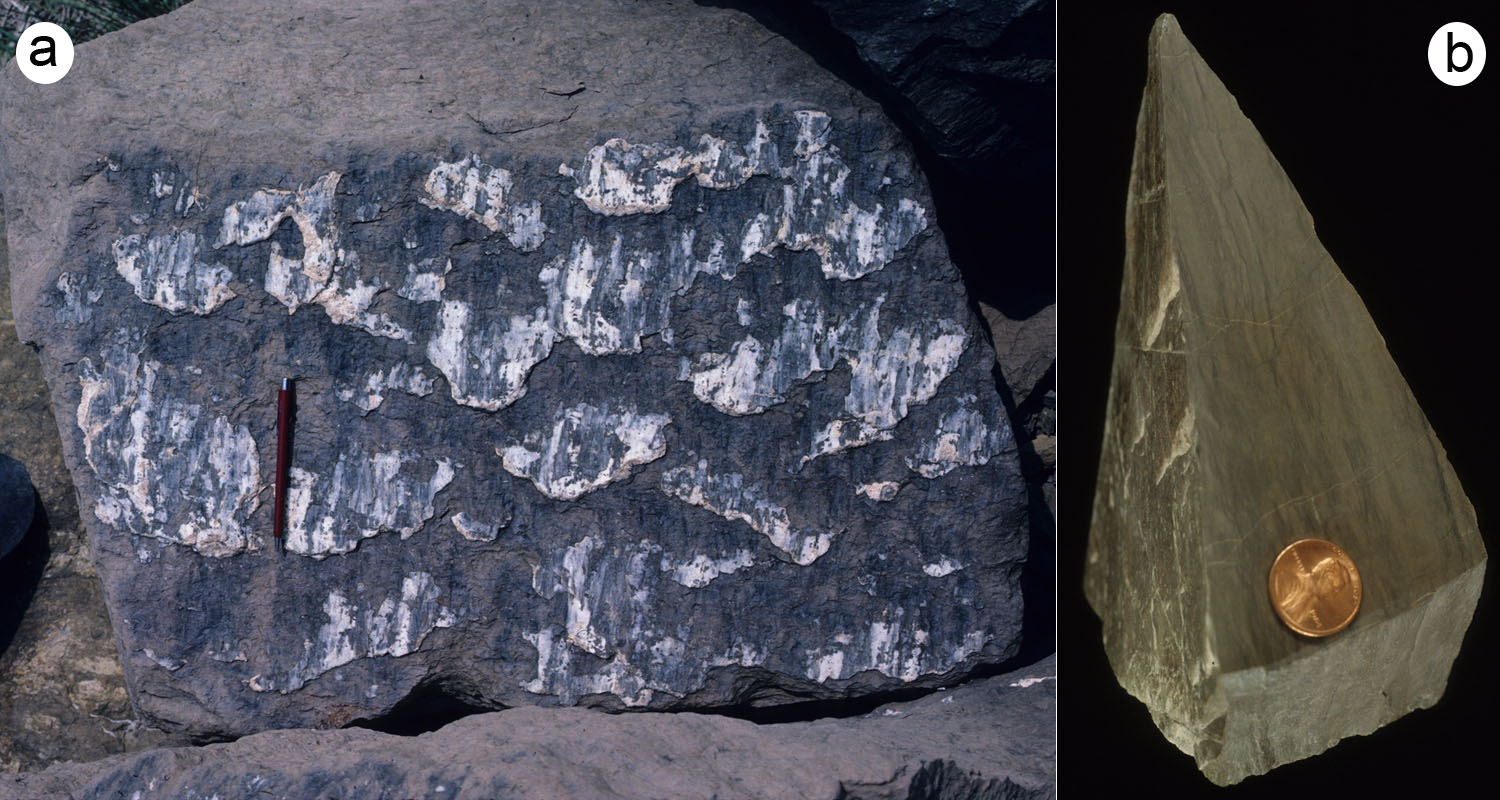
Another feature of a fault surface is the so-called steps or chatter marks (Figure 3) which are oriented perpendicular to the sip direction. These marks are sometimes used to infer the relative movement sense of the fault blocks based on the ease of a hand movement across the marks. However, this rule is risky without understanding the particular formation mechanisms of the marks. Figures 4(a and b) demonstrate one case where steps are filled by calcite and are associated with a particular segment geometry such that knowing the dilation between echelon segments permits to determine the sense of slip across the surface. If the steps are formed by, for example, small faults or slightly sheared joints may result in steps which are not likely to be relevant to the original slip sense on the main fault surface.

Steps or chatter marks on a fault surface in limestone. Ephesus, Turkey. Photo by A. Aydin.Figure 3. Steps or chatter marks on a fault surface in limestone. Ephesus, Turkey. Photo by A. Aydin.
(a) A fault surface with patches of calcite fibers. (b) A section showing how the shape and distribution of calcite deposits on a fault surface in limestone is related to the echelon geometry of fault segments making up the surface. Photo by A. Aydin.Figure 4. (a) A fault surface with patches of calcite fibers. (b) A section showing how the shape and distribution of calcite deposits on a fault surface in limestone is related to the echelon geometry of fault segments making up the surface. Photo by A. Aydin.

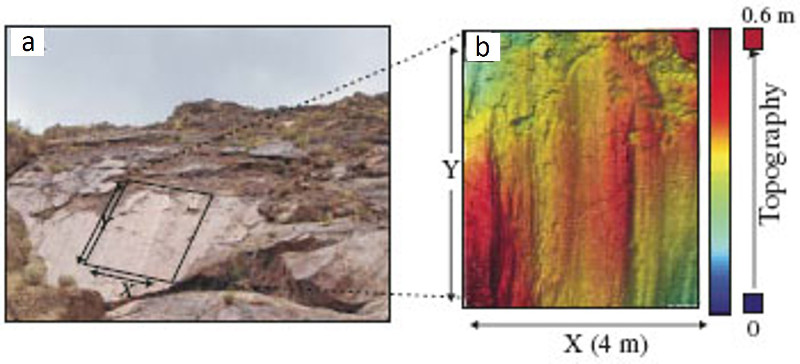
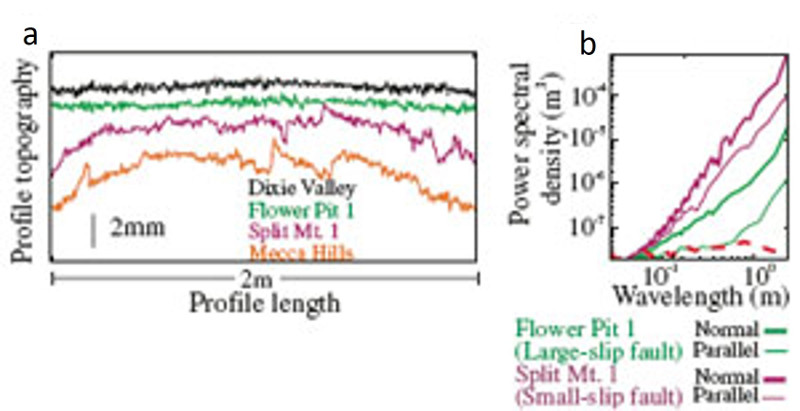
Figures 5(a and b) and Figures 6(a and b) from Sagy et al. (2007) show a ground-based Lidar image of the surface of Dixie Valley fault, Nevada. This fault is a normal fault in fine crystalline rocks with larger than 10 meter slip. Sagy and his coworkers analyzed several fault surfaces with various slip magnitudes using Lidar and Laser Profilemeter and determined that the profiles parallel to slip are smoother (have lower spectral densities) than those normal to slip. They also studied the surface roughness of several faults with varying slip and found that the faults with larger slip are smoother. Kaven and Pollard (2009) and Kaven (2010) analyzed fault surfaces using differential geometry and curvature types and proposed several categories useful for understanding their influences on the stress state on the fault surfaces.

Fault surface with a large slip analyzed for surface roughness. (a). section of partly eroded slip surface at Mirrors locality on Dixie Valley fault, Nevada. (b). Light detection and ranging (lidar) fault surface topography as color-scale map, rotated so that X-Y plane is best fit plane to surface and mean striae are parallel to Y. From Sagy et al. (2007).Figure 5. Fault surface with a large slip analyzed for surface roughness. (a). section of partly eroded slip surface at Mirrors locality on Dixie Valley fault, Nevada. (b). Light detection and ranging (lidar) fault surface topography as color-scale map, rotated so that X-Y plane is best fit plane to surface and mean striae are parallel to Y. From Sagy et al. (2007).
Surface topography parallel and normal to slip orientation. (a). Profiles from four different fault surfaces parallel to slip direction. Upper two profiles are large-slip faults and buttom two profiles are small-slip faults. (b). Power spectral density values for large-slip fault (green) and small-slip fault(magenta). Thick and thin curves are normal and parallel to slip, respectively. Each curve includes data from 200 individual 3 m profiles spaced 3 mm apart. Red dashed line represents scans of smooth, planar reference surface. Bending of power spectra at the level of about 10(-7.5) corresponds to resolution limit. From Sagy et al. (2007).Figure 6. Surface topography parallel and normal to slip orientation. (a). Profiles from four different fault surfaces parallel to slip direction. Upper two profiles are large-slip faults and buttom two profiles are small-slip faults. (b). Power spectral density values for large-slip fault (green) and small-slip fault(magenta). Thick and thin curves are normal and parallel to slip, respectively. Each curve includes data from 200 individual 3 m profiles spaced 3 mm apart. Red dashed line represents scans of smooth, planar reference surface. Bending of power spectra at the level of about 10(-7.5) corresponds to resolution limit. From Sagy et al. (2007).
Reference:

Aydin, A., Johnson, A.M., 1978. Development of faults as zones of deformation bands and as slip surfaces in sandstone. Pure and Applied Geophysics 116: 931–942.

Campagna, D.J., Aydin, A., 1991. Tertiary uplift and shortening in the Basin and Range; the Echo Hills, southeastern Nevada. Geology 19: 485-488.

Kaven, J. O., Pollard, D.D., 2009. Three-Dimensional Geometry of a Fault Slip Surface: Implications for the Mechanics of Non-Planar Faults. Stanford Digital Repository. Available at: http://purl.stanford.edu/nx183qz2158.

Kaven, J. O., 2010. Geometry and mechanics of three-dimensional faults: Implications for slip, aftershocks, and paleostress. Ph. D. thesis, Stanford University, 144p. http://purl.stanford.edu/kd973dc7091.

Sagy, A., Brodsky, E.E., Axen, G.J., 2007. Evolution of fault-surface roughness with slip. Geology 35 (3): 283-286.


Readme    |    About Us    |    Acknowledgement    |    How to Cite    |    Terms of Use    |    Ⓒ Rock Fracture Knowledgebase