| |
|
| |
Rock Fracture
KNOWLEDGEBASE | |
| |
|
|
|
|
| Compaction Band Length - Thickness Scaling | |
|
|
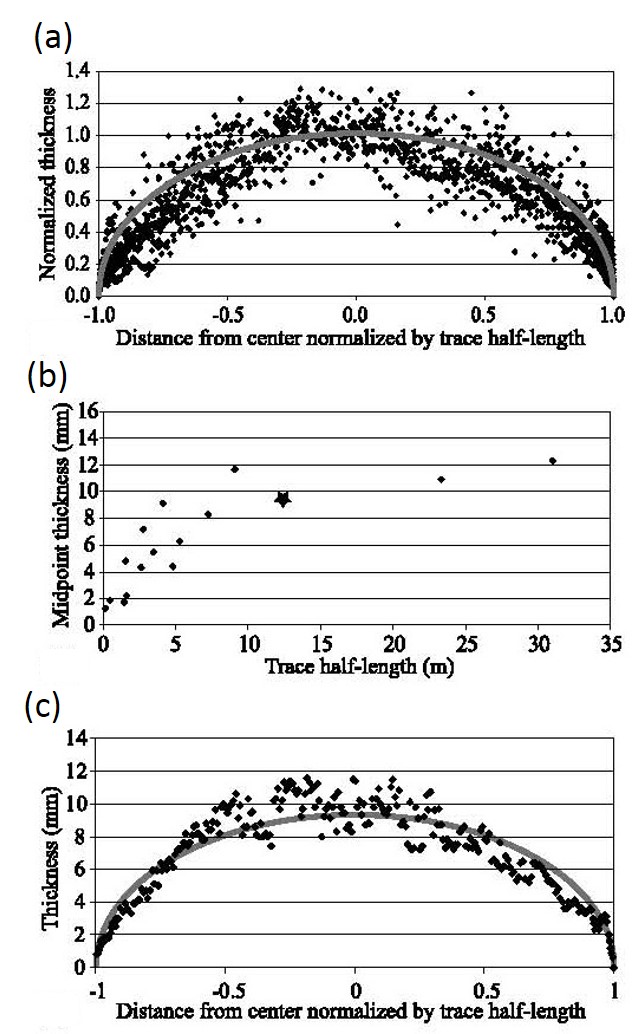
One of the most extensive data sets on the relationship between the thickness and length for compaction bands is that by Sternlof et al. (2005) (Figure 1). It appears that compaction band thickness varies along the traces of the bands (a) with the maximum values with an initial linearly increasing trend before flattening beyond about 10 m half length (b). Note that the plot in (c) shows the thickness data for a particular compaction band of slightly longer than 24 meters.
 | | Figure 1. (a) Thickness profiles for 16 single compaction bands in Aztec Sandstone in Valley of Fire State Park, Nevada. From Sternlof et al. (2005). Thickess is normalized by the half point values and position is normalized by the band half length. (b) Plot of mid point thickness versus trace half length. Star indicates the deformation band measured in (c), which is 24.75 m long. |
| |
|
Reference:
|
Sternlof, K.R., Rudnicki, J.W., Pollard, D.D., 2005. Anticrack inclusion model for compaction bands in sandstone. Journal of Geophysical Research 110: B11403, doi:10.1029/2005JB003764.
|
|
Readme |
About Us |
Acknowledgement |
How to Cite |
Terms of Use |
Ⓒ Rock Fracture Knowledgebase
|