|
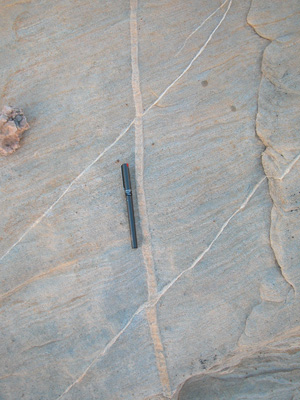
In general, compaction bands are thicker than shear bands at the same locality (Figure 1). For example, shear bands in Aztec Sandstone at Valley of Fire State Park, Nevada, are of a few millimeters thick, while compaction bands at the same formation and locality have an average maximum thickness of about 1.2 cm (Sternlof et al., 2005; Deng and Aydin, 2012). Compaction bands about 2 to 3 cm thick are not uncommon.
 | | Figure 1. Two shear bands (diagonal) offsetting a compaction band (N-S or up and down) in Aztec Sandstone, Valley of Fire State Park (NV). Notice that the shear bands are much thinner than the compaction band. |
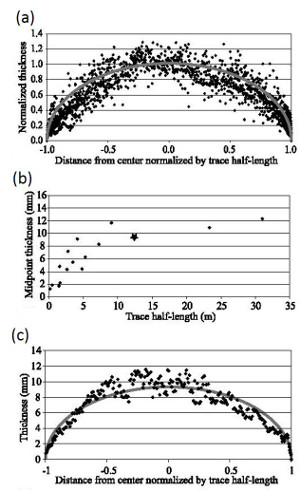
Sternlof et al. (2005) measured tip-to-tip thickness profiles of two-dimensional compaction band traces in Valley of Fire State Park using a steel tape and calipers and constructed the thickness distribution along each band (Figure 2(a)). The maximum thicknesses of 16 individual compaction bands ranges from about 0.1 cm to 1.2 cm. While midpoint thickness for these profiles generally increases with increasing trace length, it does so with a decreasing rate that suggests a plateau of maximum attainable thickness independent of larger values of trace length (Figure 2(b)). This issue will be revisited under the scaling relationships.
 | | Figure 2. (a) Thickness profiles for 16 single compaction bands in Aztec Sandstone in Valley of Fire State Park, Nevada. From Sternlof et al. (2005). Thickess is normalized by the half point values and position is normalized by the band half length. (b) Plot of mid point thickness versus trace half length. Star indicates the deformation band measured in (c), which is 24.75 m long. |
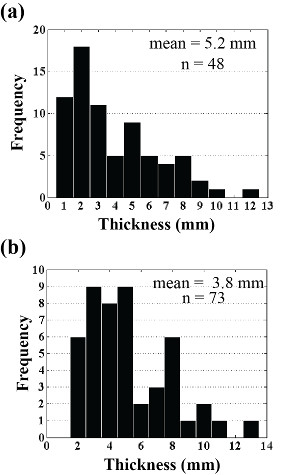
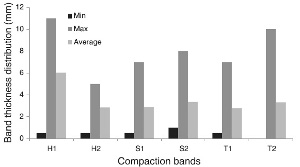
Figures 3(a) and 3(b) are thickness distributions of different sets of compaction bands (high-angle to bedding and bed-parallel, respectively) at the same location (Deng and Aydin, 2012) and Figure 4 shows thickness distribution of high-angle to bedding dominant compaction bands at different locations (Torabi et al., 2015).
 | | Figure 3. Comparing the thicknesses of compaction bands (min, max, and average values) at three different locations at Valley of Fire State Park, Nevada. H, S, and T stand for locations first studied by Hill (1989), Sternlof (2006), and Torabi et al. (2015). From Torabi et al. (2015). |
 | | Figure 4. Mean thicknesses of compaction bands in bed-perpendicular and bed-parallel orientations whose length distributions were plotted under 'Compaction Band Length.' The compaction bands at high-angle to bedding appear to be thicker than those parallel to bedding. From Deng and Aydin (2012). |
| |
Deng, S., Aydin, A., 2012. Distribution of compaction bands in 3D in an aeolian sandstone: The role of cross-bed orientation. Tectonophysics 574–575: 204–218. http://dx.doi.org/10.1016/j.tecto.2012.08.037.
Sternlof, K.R., Rudnicki, J.W., Pollard, D.D., 2005. Anticrack inclusion model for compaction bands in sandstone. Journal of Geophysical Research 110: B11403, doi:10.1029/2005JB003764.
Sternlof, K.R., 2006. Structural geology, propagation mechanics and hydraulic effects of compaction bands in sandstone. Ph.D. Dissertation, Stanford University.
Torabi, A., Aydin, A., Cilona, A., Jarsto, B.E., Deng, S., 2015. The dynamics and interaction of compaction bands in Valley of Fire State Park, Nevada (USA): Implications for their growth, evolution, and geostatistical property. Tectonophysics 657: 113-128. http://dx.doi.org/10.1016/j.tecto.2015.06.029.
|


