| |||||||
|
|
|||||||
|
|
|||||||
| Scaling between Fault Length and Maximum Splay Length | |||||||
|
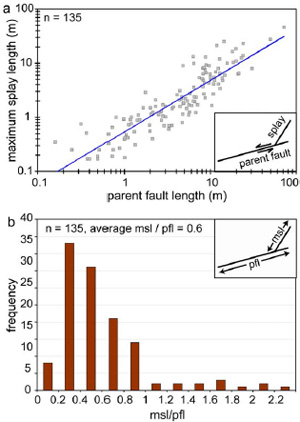
de Joussineau and Mutlu (2006) and de Joussineau et al. (2007) presented data from sheared joint-based strike-slip faults in Aztec Sandstone exposed at Valley of Fire State Park, Nevada that correlates the length of the longest splay to the length. The authors took measurements from 135 left- and right-lateral faults ranging from 16 cm to 72 m in length throughout three units of the exposures. They identified cases where the propagation of the splays was not perturbed or stopped by any structural obstacle. Accordingly, the splays measured are the longest splays produced by the faults. Figure 1 shows the fault length versus the maximum splay length data plotted in log-log scale. Figure 1a shows that the maximum splay length (msl) is correlated to the parent fault length (pfl) by a nearly linear power law, as shown in Equation 1. Figure 1b shows the frequency distribution of msl to pfl ratio for the same data set. Most of the ratios range from 0.2 to 1 and on average the maximum splay length is equal to 60% of the fault length.
The maximum splay length does not correlate to the fault slip as strongly as the fault length does where slip can be identified. This is possibly because the maximum slip has not been measured accurately. It may also be due to the mechanism of fault growth by segment linkage which affects the fault slip distribution. | |||||||
| Reference: |
|||||||
| de Joussineau, G., Mutlu, O., 2006 de Joussineau, G., Mutlu, O., Aydin, A., Pollard, D.D., 2007 |
|||||||
|
Readme | About Us | Acknowledgement | How to Cite | Terms of Use | Ⓒ Rock Fracture Knowledgebase |
|||||||
