| |||||||||
|
|
|||||||||
|
|
|||||||||
| Fault Length Distribution | |||||||||
|
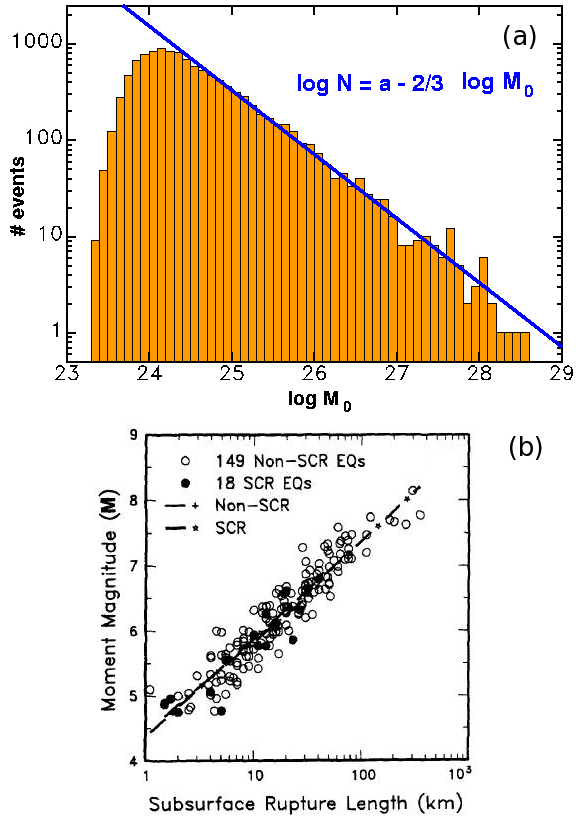
The lengths of faults range from the microscopic scale to the crustal scale over thousands of kilometers in a systematic fashion. This is illustrated in the frequency-size (magnitude or seismic moment) diagram for earthquakes in a region for a given time window. Figure 1(a) shows such a typical earthquake frequency versus seismic moment diagram which indicates that there are always many more smaller earthquakes than larger ones. Since the seismic moment is proportional to the rupture area (or for constant depth or the crustal thickness to the rupture length), the graph may also represent an exponential frequency-fault rupture length relationship (Figure 1(b)). All other fault length data used in conjunction with either maximum slip or a fault zone width will be presented under fault scaling. It suffices to note that the measured fault lengths span from sub-centimeters to greater than 1000 kilometers and that there are always an exponentially larger number of smaller faults than that of the known larger ones.
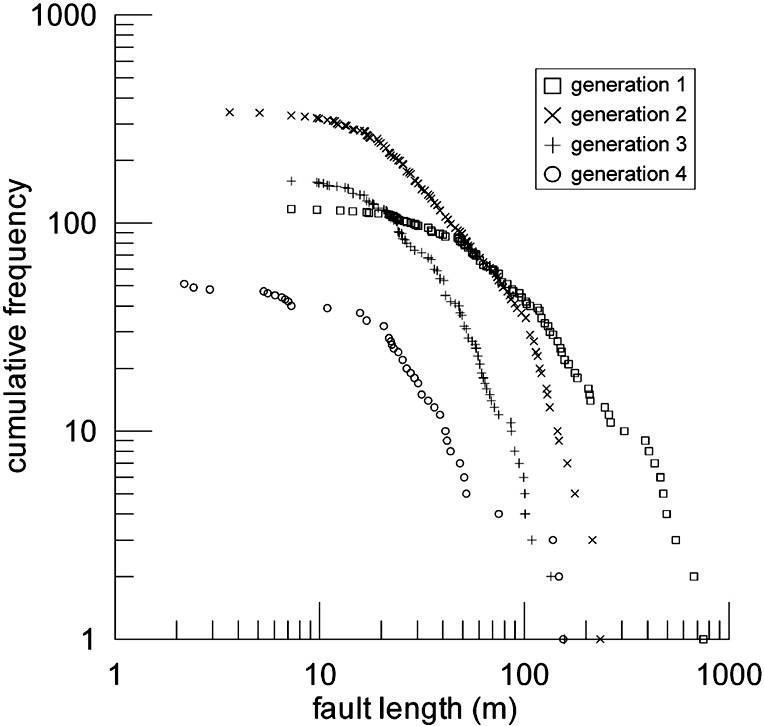
One of the most important characteristics of faults, similar to other fracture types, is that the earlier fractures have a strong influence on the formation and the geometry of the later ones. This is nicely illustrated by Figure 2 which shows measurements from a hierarchical fault network broken down into four generations mapped in Valley of Fire State Park, Nevada. Each generation has its own distribution which represents the evolution of the system. Note that the lower ends of the length distributions for each generation indicate sampling limitations and the linear portions have different slopes or different power law distributions.
| |||||||||
| Reference: |
|||||||||
| Flodin, E.A., Aydin, A., 2004 Wells, D.L., Coppersmith, K.J., 1994 |
|||||||||
|
Readme | About Us | Acknowledgement | How to Cite | Terms of Use | Ⓒ Rock Fracture Knowledgebase |
|||||||||