| ||||||||||||
|
|
||||||||||||
|
|
||||||||||||
| Joint Propagation Velocity | ||||||||||||
|
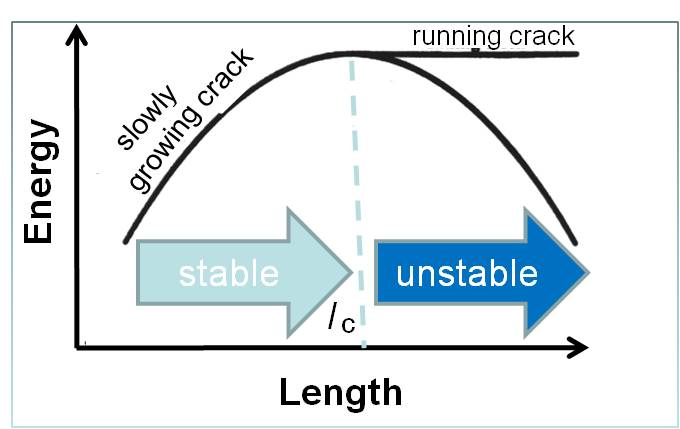
Joint propagation velocity depends on the stress intensity at the joints' tips and has a wide range of values. Figure 1 from Marder and Fineberg (1996) shows this range schematically with two categories characterized by slow or stable propagation and dynamic or unstable propagation. The critical value of the energy needed for the transition from one category (subcritical) to another (beyond critical) also corresponds to a critical length for a given system. Marder and Fineburg (1996), based on theoretical considerations, discussed that fracture propagation in different velocities produces fractures with different surface morphology. Engelder (2004) supported this relationship by a detailed field study of two sets of joints with inferred different rupture velocities: One with a well defined plumose pattern in fast growth range and another with a smooth surface in an inferred slow growth case. See the section 'Surface Morphology / Roughness of Joints - Plumose Structure.'
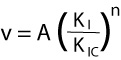
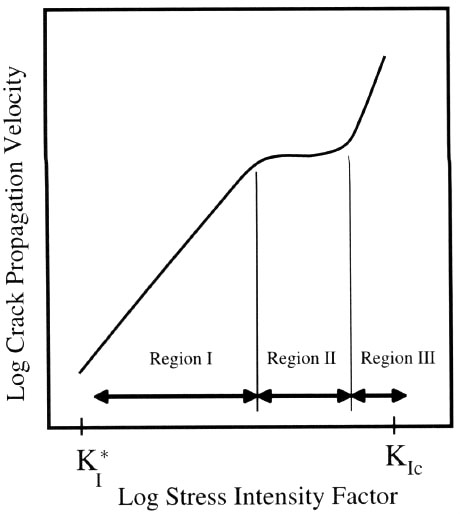
Renshaw and Pollard (1994) and Olson (2004) demonstrated the influence of subcritical joint propagation velocity on the spatial arrangement or joint spacing in the subcritical region where the joint propagation velocity followed an empirically quantifiable relationship. The subcritical index represents the importance of propagation in the subcritical region; the higher the value, the less important subcritical propagation is, as very little propagation occurs before a certain stress level is reached. With varying subcritical index, it is possible to form regularly spaced joints in a set as well as clustered joints (localization of joints into a zone). For detailed discussion, see the section, 'Joint Spacing Affected by Rock Subcritical Index.' Three regions in the plot of propagation velocity vs. stress intensity (Figure 2) are recognized (Lawn and Wilshaw, 1975 among others). Subcritical propagation refers to the stage in which fractures propagate below the critical toughness, commonly called region I. The importance of subcritical growth for geological situations is that it is a stable propagation mechanism, in which the propagation velocity, v, is related to the opening-mode stress intensity factor at the crack tip, K(I), with an empirically quantifiable, power-law relationship (Equation 1). Here, K(IC) is the critical mode-I (opening mode) fracture toughness, 'n' is the subcritical index, and 'A' is proportionality constant. The power-law exponent, 'n,' can vary widely depending on rock type and environmental conditions (such as dry vs. wet). The higher the value of the subcritical index, the less important subcritical growth becomes, as very little if any propagation occurs before the fracture toughness is reached. For a given rock type, the subcritical index typically decreases with increasing water content in the environment. Reported values vary from 20 or less for tests carried out on sandstone submerged in water to greater than 250 under dry conditions in carbonate rock. Work in clastic sedimentary rocks suggests that grain size, grain mineralogy, cement type, and porosity can influence the value of the subcritical index for a given environmental condition (Olson, 2004).
| ||||||||||||
| Reference: |
||||||||||||
| Engelder, T., 2004 Lawn, B.R., Wilshaw, T.R., 1975 Marder, M., Fineberg, J., 1996 Olson, J., 2004 Renshaw, C., Pollard, D.D., 1994 |
||||||||||||
|
Readme | About Us | Acknowledgement | How to Cite | Terms of Use | Ⓒ Rock Fracture Knowledgebase |
||||||||||||