| ||||||||||||||||||
|
|
||||||||||||||||||
|
|
||||||||||||||||||
| Shear Band Length - Displacement Scaling | ||||||||||||||||||
|
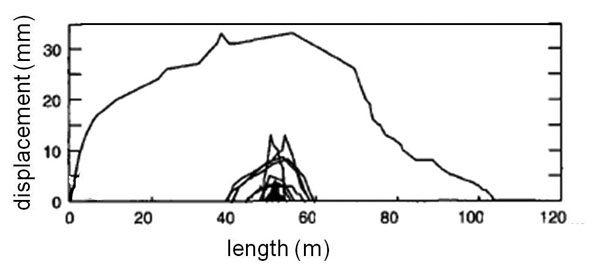
Generally, shear band lengths and displacements are related, albeit this relationship is some what different than the displacement-length relationship for faults, which apparently form by different mechanisms and generally the published statistical data from faults do not include the faulting mechanism. See 'Scaling between Fault Length and Fault Maximum Slip.' Figure 1 shows some data from several shear bands in the Entrada Sandstone exposed at the San Rafael Desert, Utah (Fossen and Hesthammer, 1997). For bands consisting of a single segment, almost all displacement profiles exhibit upward-convex shape. The displacement maximum may be located in the central portion of the bands.
For shear band zones composed of multiple sub-parallel echelon segments (Figure 2), the authors distinguished two types: soft-linked, where segments are not in physical contact, and hard-linked, where segments touch each other (see Walsh and Watterson, 1991 for terminalogy, and Carthright, 1995, for the evolution of the slip distribution along normal faults). The two types differ presumably in the way strain is transferred from one segment to another, either ductilly across soft-linked zones or brittlely across hard-linked zones.
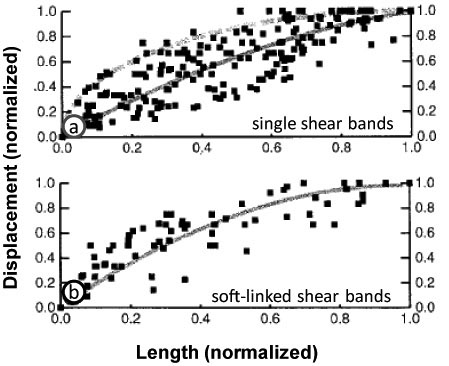
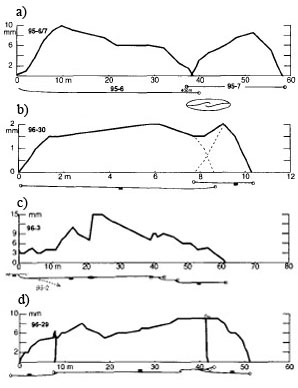
For soft-linked zones, segments develop individually until a degree of overlap is reached, resulting in a combined system. The displacement profiles (Figure 3) corresponding to this process evolve from a multipeak type, through a plateau type, and will eventually be a coherent single peak type. At the soft-linked stage, the majority of the profiles show steeper gradient towards the tip in the overlap zone than towards the independent tip, similar to what was described for weakness-based faults (see Willemse et al., 1996). The schematic development of a displacement profile along a hard-linked shear band zone is similar to that of a soft-linked zone, from multipeak-type, followed by plateau-type, to single peak profile if growth occurs without further linkage. Figure 3 shows some example profiles of hard-linked zones.
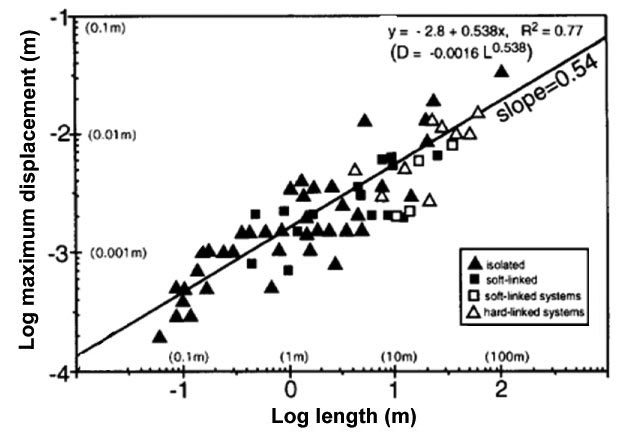
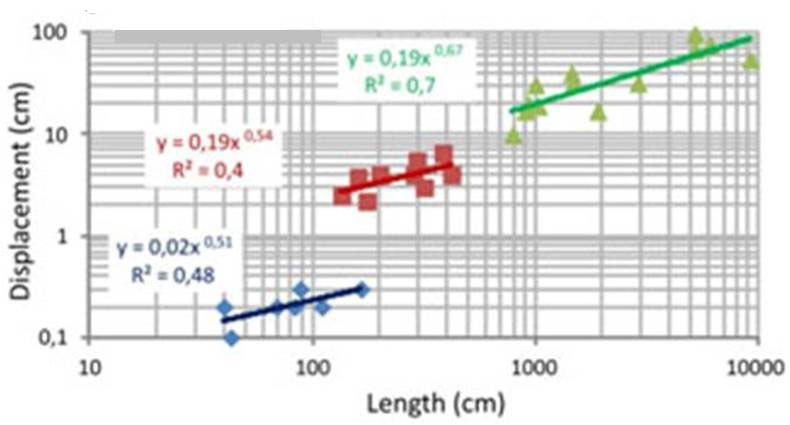
Figure 4 shows a length-displacement log-log plot for shear bands within the Entrada Sandstone referenced above (Fossen and Hesthammer, 1997). A best fit linear line has a slope of 0.54, which is much smaller than faults reported by others. Figure 5 shows a log-log plot of displacement-length data from shear bands in carbonate grainstone exposed in the island of Favignana, west of Sicily (From Tondi et al., JSG in review). The data shows linear trends for single shear bands, zones of shear bands, and shear band zones with slip surfaces. However, there are strikingly noticeable jumps from one data set to another implying well-defined forms in the scaling properties as the structures evolve from simple shear bands, to shear band zones, and finally to shear band zones with slip surfaces.
| ||||||||||||||||||
| Reference: |
||||||||||||||||||
| Cartwright, J.A., Trudgill, B.D., Mansfield, C.S., 1995 Fossen, H., Hesthammer, J., 1997 Tondi, E., Cilona, A., Agosta, F., Aydin, A., Rustichelli, A., Renda, P., Giunta, G., 2012 Walsh, J.J., Watterson, J., 1991 Willemse, E.J.M, Pollard, D.D., Aydin, A., 1996 |
||||||||||||||||||
|
Readme | About Us | Acknowledgement | How to Cite | Terms of Use | Ⓒ Rock Fracture Knowledgebase |
||||||||||||||||||